

Confluence Investment Management offers various asset allocation products which are managed using “top down,” or macro, analysis. We publish asset allocation thoughts on a bi-weekly basis, updating the report every other Monday, along with an accompanying podcast.
[Note: This report will go on holiday hiatus following today’s report; the next report will be published on January 16, 2023.]
December 5, 2022
One of the challenges of market strategy is the problem of financial stress. In colloquial terms, the “Fed raises rates until something breaks.” The problem is that the “something-breaks” event is difficult to predict in terms of when. There are numerous financial stress and conditions indices that suggest rising financial tensions. These tell us when conditions are such that problems might develop, but they don’t help us much with when a problem is likely to emerge.
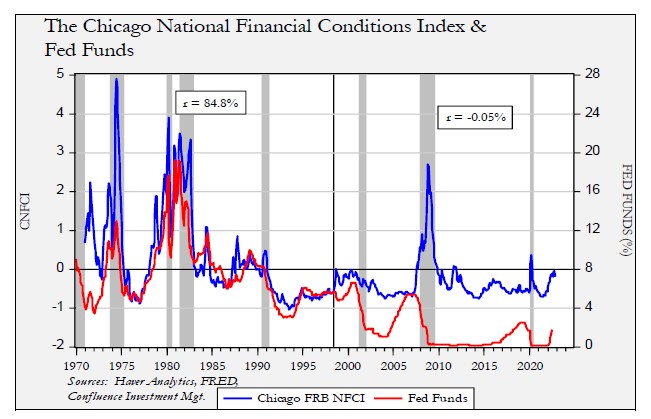
This chart shows the Chicago FRB’s National Financial Conditions Index (CNFCI). A reading of zero shows normal conditions, while any number less than zero implies favorable conditions. Before mid-year 1998, financial conditions were highly correlated to the fed funds rate. Since 1998, the two series have become almost entirely uncorrelated. In 1998, the U.S. passed the Financial Services Modernization Act, often named for its authors, Senators Gramm, Leach, and Bliley. This act changed the nature of the financial system as it was mostly bank-financed prior to this legislation. The 1998 act allowed other financial participants to engage in lending and other bank-like activities. Essentially, the U.S. financial system became money market-financed after 1998.
This change was designed to improve the efficiency of the financial system, but it also changed the “lender of last resort” function of the Federal Reserve. Before 1998, if the FOMC raised rates, financial conditions deteriorated, but that problem could be easily addressed with rate cuts. But note that after 1998, the fed funds rate became ineffective in either improving or weakening financial conditions. The 2004-09 period is the best example of this problem as the FOMC raised rates with little impact on financial conditions. Once a crisis developed (shown as a jump in the CNFCI), it took very aggressive rate cuts and promises to keep rates low for a long period of time before conditions improved. Something similar developed in 2020 around the pandemic.
Currently, we are in a tightening cycle. The CNFCI has increased but remains below zero. However, the worry remains that if the FOMC keeps raising rates, “something will break” which is represented by a spike in the index. The notion of the “Fed pivot” is based on the expectation that as conditions deteriorate, the Fed will rapidly reverse policy tightening, which would be bullish for financial assets. If something breaking is a prerequisite for the pivot, it would be useful to have some idea of when that might occur.
One way we attempt to determine when a tightening cycle may be poised to end is to compare the fed funds target to the implied three-month LIBOR rate from the Eurodollar futures market.
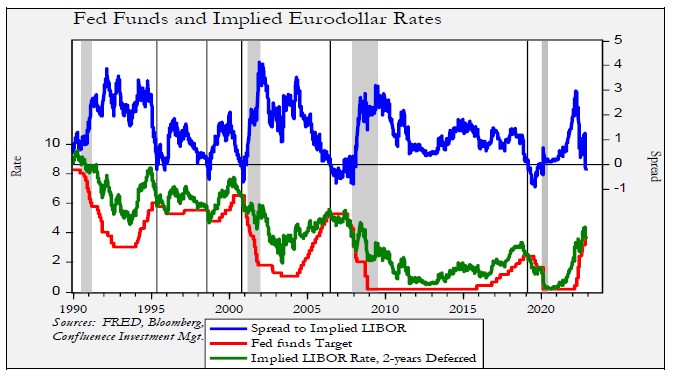
LIBOR rates represent funding costs for money market lending. In general, because this collateral or the counterparties are not necessarily guaranteed by the government, it is reasonable to expect that the LIBOR rate should exceed the fed funds target. And, as the top line of the chart indicates, most of the time it does. However, on occasion, the spread inverts. We have placed vertical lines on the above chart showing when these inversions have occurred. Inversion suggests that the financial markets have assessed that the FOMC has raised rates enough and should either stop raising rates or consider cutting them. In the 1990s, during the Greenspan Fed, rates were cut quickly when this spread inverted. And, for the most part, he supervised a long expansion and even the 2001 recession was considered rather mild. Contrast that with the Bernanke Fed’s decision to hold rates steady for an extended period even though the Eurodollar/fed funds spread had become inverted. The recession that followed was very deep and was accompanied by a financial crisis.
To further analyze the impact of the spread of the implied LIBOR rate to fed funds, we created the below chart.
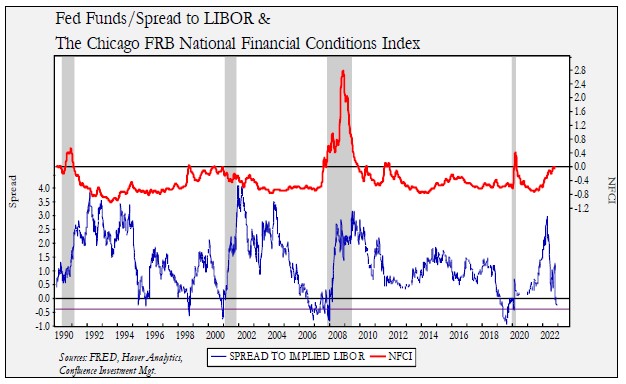
The lower part of this chart shows the fed funds/implied LIBOR spread. We have placed a purple line at the -40 bps level, and when this level is penetrated, it has tended to signal that a financial accident is more likely. In the past two events, an inversion below the -40 bps line was followed by a crisis six to 12 months later. We are not at that point yet, but if the FOMC moves the fed funds target up by 50 bps in mid-December, the chances increase that we will see the spread invert below this level.
The Fed has two formal mandates and one universal mandate. Its two formal mandates are full employment and low inflation. These are legislated by Congress and defined by the Fed, but all central banks exist to support the functioning of financial markets. We are seeing conditions evolve to a point where the FOMC may need to stop tightening or even ease in order to address the universal mandate. However, that may force the Fed to ease before it contains inflation. We suspect that the Fed will probably attempt to bring down inflation while hoping to avoid a financial problem. In fact, the recent signal that the pace of hikes will slow may be designed to avoid an “accident.” By moving less aggressively, we surmise that the FOMC hopes it can still bring down inflation and avoid a financial crisis. Nevertheless, the chances of a financial accident appear poised to grow in the coming months.
Past performance is no guarantee of future results. Information provided in this report is for educational and illustrative purposes only and should not be construed as individualized investment advice or a recommendation. The investment or strategy discussed may not be suitable for all investors. Investors must make their own decisions based on their specific investment objectives and financial circumstances. Opinions expressed are current as of the date shown and are subject to change.
This report was prepared by Confluence Investment Management LLC and reflects the current opinion of the authors. It is based upon sources and data believed to be accurate and reliable. Opinions and forward-looking statements expressed are subject to change. This is not a solicitation or an offer to buy or sell any security.