
Rejoice! After dealing with the run-of-the-mill 2% and 3% outlier days, the S&P 500 popped off for +5.6% on Thursday. This was the largest single up day seen in 2022. The day’s rally came on news of inflation. While inflation was expected to be around 7.9%, it actual numbers showed that it was only… drum roll please… 7.7%! Problem solved, right? While some investors might feel a bit of relief in seeing the market sharply rise in a single day, the reality is that this is typical bear market behavior.
Thursday’s large up move chalks up another outlier day* (a single trading day beyond +/-1.50%) for the market. During a normal, “bull” market environment, the expected total would have been around 13 outlier days in a given year. This year, there have been 74 outlier days, more than five times the expectation. Shockingly, there have been more outlier days that have been “up” this year than “down.”
Seeing a single trading day beyond +5% is shocking, although not unprecedented during a bear market. The market is acting irrational right now, and possibly overreacting to slightly to a “better-than-expected” news event. Whether the market was up +4%, 5%, or 10%, it does not really make a difference. In other words, irrational is just irrational, and +5.6% is just where the market was at 4pm EST. The movement increased volatility (as measured by the Canterbury Volatility Index, or CVI) to CVI 142, which is just a few points below its high for the year. For those unfamiliar with CVI, a normal bull market environment typically has volatility below CVI 75. Right now, it is almost double that “rational” volatility level.
Just for fun, if we draw an arbitrary line in the sand at a daily advance at +5%, here are a few market statistics:
- Since 1970, the market has had 23 trading days of at least +5%.
- Of the 23 occurrences, 5 of them occurred during the 2020 Pandemic, which has been defined as a “trading anomaly”—a parabolic drop followed by a quick rebound over a short period, almost as if nothing happened. The S&P dropped by -30% in about a month and returned to a new peak just 5 months later.
- During the bear markets of the early 2000s and the Financial Crisis, there were twelve days of at least +5% (3 during the tech crash in the early 2000s and 9 during the Financial Crisis). All but 2 of those +5% days occurred prior the market’s ultimate low. The 2 that came after the low occurred in March of 2009, which is the same month we saw the market’s bottom during the Financial Crisis.
We have already established that what we are in a legitimate bear market and not a short-term treading anomaly. Bear markets are irrational. The market could have just as easily been down -5% or even up +10%. The erratic move seen Thursday is not likely the start of a new a bull market.
Market Leadership
For the last few months, technology stocks have lagged, while other sectors like Energy and Industrials have led. If we look at the market’s strength during Thursday’s large up move, it was led by the stocks had been hurt the most.
On Thursday, over half the stocks in the S&P 500 were up at least 5%, and 60 stocks were up over +10%. Only 18 stocks (out of the 500 components) were down on the day. On the surface, that may sound great. When we look deeper at the biggest movers that day, and compare it the biggest laggards, there was a surprising result.
If we look at Thursday’s top 50 S&P 500 performers, they were up an average of 12.87%. The bottom 50 performing stocks were down, on average (-0.09%). That said the top 50 stocks were still down -32%, on average, from their 52-week highs. That average includes the Thursday’s large move. On the other hand, Thursday’s worst performers were only -6,73% below their 52-week highs.
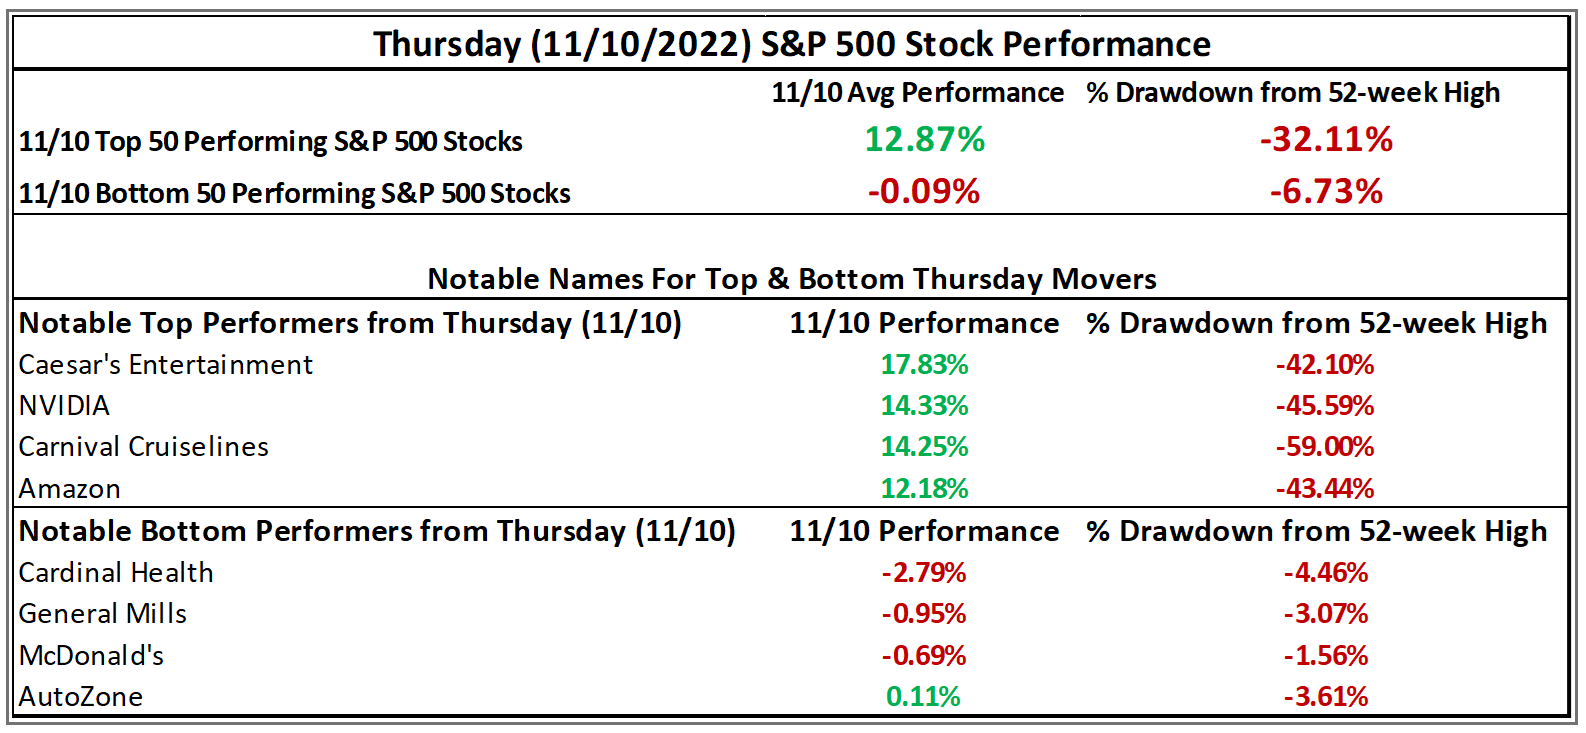
Source: Canterbury Investment Management using data provided by Optuma Technical Analysis Software. Return data is through 11/10/2022. Percent Drawdown data was taken as of 11/10/2022 close. Notable Top/Bottom performers were chosen arbitrarily.
Bottom Line
Much of this update was written about a single day move, but we do not want to place great importance on just one, random fluctuation during a bear market. Our objective is to highlight the move and point out that these large outliers occur in bear markets and are irrational. Any random event can create large market noise in a bear market. If inflation would have been 0.2% higher than expected, would the market have gone down -5%?
What would be expected is to see the stocks that have seen the largest, parabolic advances over the last several years, also have the biggest declines. This is what we have seen in many of the technology-related stocks. It is also normal to see a short “bear market rally” in these beaten-up stocks when most would least expect.
As for the broader market perspective, the S&P 500 and most major indexes remain in a bear market, with a continued pattern of lower highs and lower lows. The current short-term fluctuation still fits that pattern.
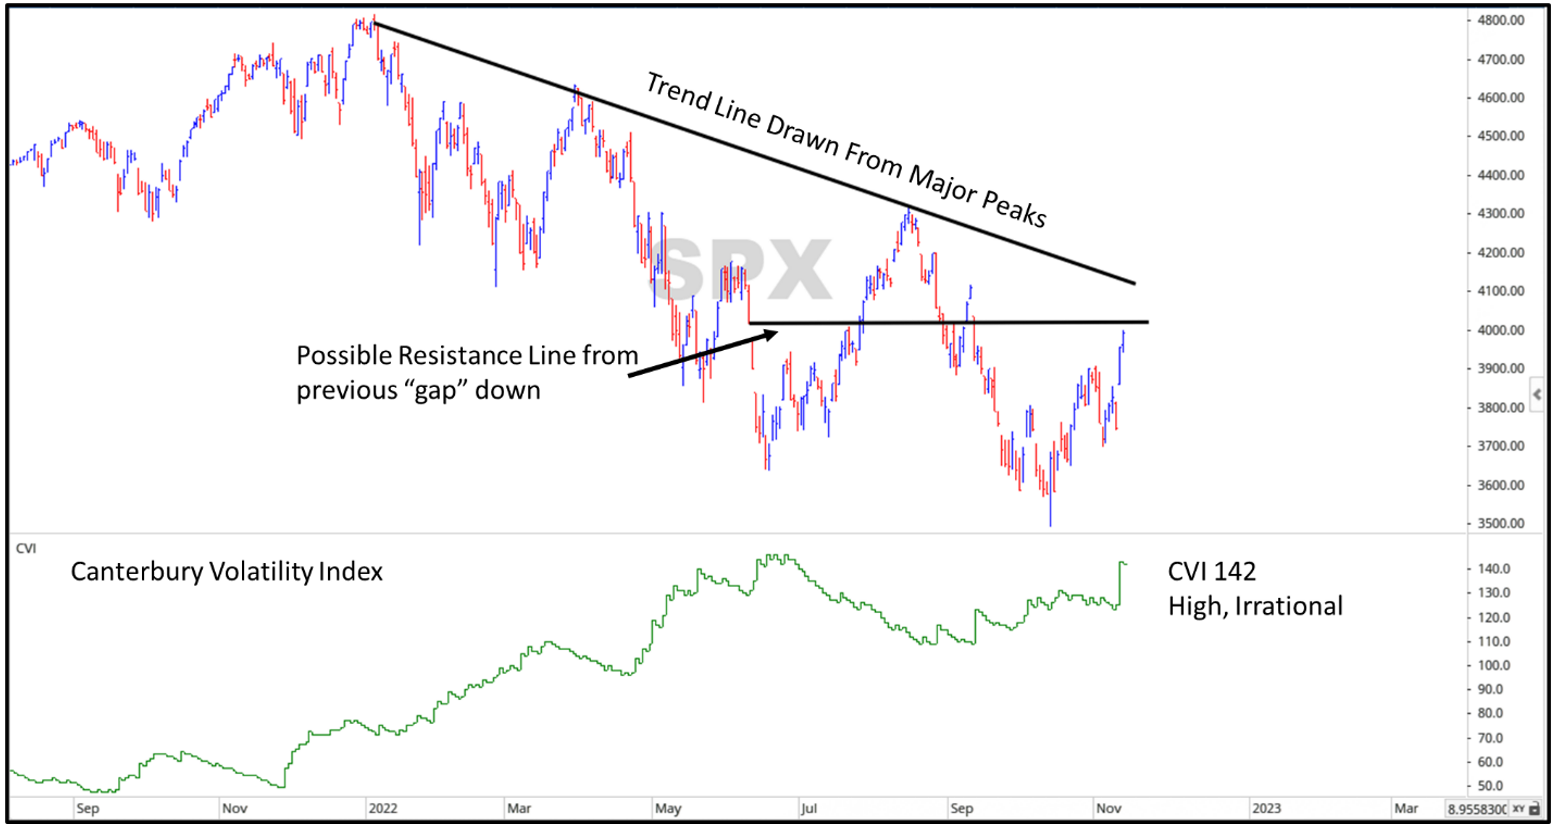
Source: Canterbury Investment Management using charting data provided by Optuma Technical Analysis Software
The Canterbury Portfolio Thermostat, which is an adaptive portfolio, continues to monitor for any changes in market strength. During the two days last week, technology stocks outperformed. Two days, however, is not a trend. Right now, the trends still favor energy stocks and industrials, and several inverse securities. Volatility is still high and is increasing. All signs still point to this being a bear market.
*Outlier Day Definition: Canterbury defines an Outlier Day as any singular trading day beyond +/-1.50%. We arrive at this definition through empirical study on Market States and bell curve data. During a Canterbury-defined Bullish Market State (defined using objective, technical indicators), the daily standard deviation of the S&P 500 has been 0.75% dating back to 1950. Therefore, using bell curve math, a trading day of beyond +/-1.50% (two standard deviations) should occur in 5 out of 100 instances. During a low volatility, bull Market State, you would expect to see about 13 outlier days in a single year. During a bearish or transitional Market States, outlier days occur more frequently.
For more news, information, and strategy, visit VettaFi.com.
