
With equity and bond markets down and recessionary risks building, many are wondering where we go from here. We think that it is important to have an economic and market view that is based on data processed through a time-tested investment discipline. Unbiased discipline can help provide clarity and enable investors to make unemotional decisions in a chaotic world.
We look at incoming data through the prism of our Three Layers of Risk Management. These layers include our strategic three- to five-year outlook, our tactical six- to eighteen-month view, and the Cash Indicator. Today, we are seeing compelling opportunities both strategically and tactically to protect assets and potentially benefit from this challenging investment environment.
From a strategic perspective, at these valuation levels the longer-term outlook for U.S. equities is better than it has been since the pandemic selloff in the spring of 2020. Similarly, higher current interest rates mean that investors can purchase high quality fixed income and realize attractive yields. In short, our strategic outlook has brightened based on more attractive valuations.
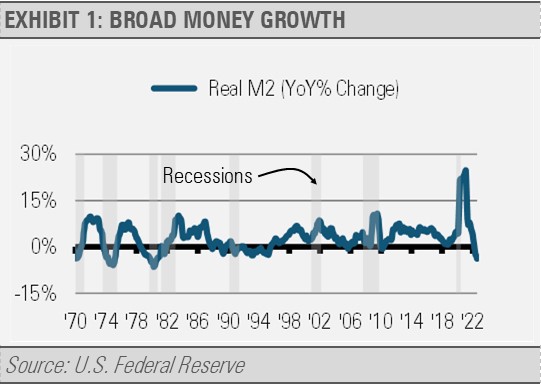
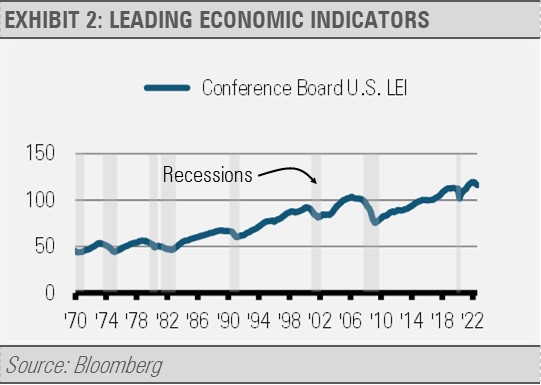
Tactically, our work suggests an increasing probability of a recession next year. Though coincidental indicators, such as business surveys and jobs creation, imply that the U.S. economy continues to grow and is not currently in a recession, several of our leading indicators are flashing cautionary signals. For example, both broad money (M2) growth and the Conference Board’s Leading Economic Index have weakened persistently in recent months (exhibits 1 and 2). These factors portend some level of economic weakness in the months and quarters ahead.
It is important to keep in mind that the markets can be a leading indicator as they attempt to price in future economic conditions. As far as current market valuations are concerned, consideration must be given to the idea that some portion of future recessionary conditions may be already priced into the market. Although we cannot know exactly how much, we have seen that markets historically begin to recover prior to the end of a recession. In this way markets can lead both the economic downturn and recovery.
The exact timing and depth of a recession is impossible to predict. However, the strength of household and corporate balance sheets suggests that any recession should be rather brief and shallow. This situation contrasts with what we saw going into the 2007-2009 Global Financial Crisis (GFC) when leverage was high and balance sheets were weak. For example, household debt service payments as a percentage of disposable income peaked at 13.17% prior to the GFC and is just 9.58% today.
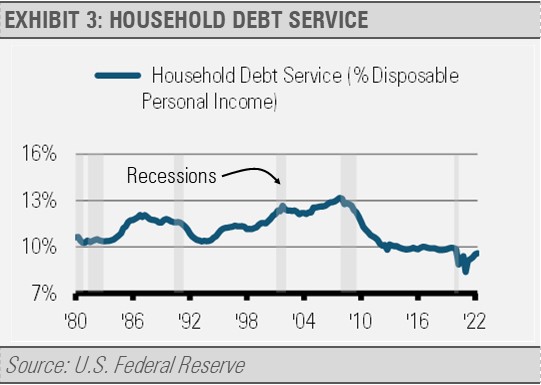
Relative to disposable income, debt service in 2007 was more than 37% higher going into the GFC than it is today. This elevated level of debt to income resulted in a drawn-out recession and a slow recovery as balance sheet repair and deleveraging was needed. In fact, household debt service to income is lower today than during any previous business cycle going back to 1980, which means households in aggregate should be better able to deal with economic weakness than during previous cycles.
Equity markets tend to decline during recessions as corporate earnings fall and business concerns grow. Though the magnitude of market declines varies greatly across recessions, they average about a 30% drop from previous highs. Using business cycles and market history as a guide, this leads us to think that most, though perhaps not all, of the risk to the U.S. equity market is already priced in. However, we may be in for a sustained period of volatility with both occasional strong rallies as well as declines. Therefore, we remain underweight equity market exposure and the equity allocations we do have emphasize defensive areas.
Note that the equity market typically bottoms and begins to rally months before a recession ends (exhibit 4). Though there is a fair amount of variability, the market usually bottoms approximately halfway or more through a recession.
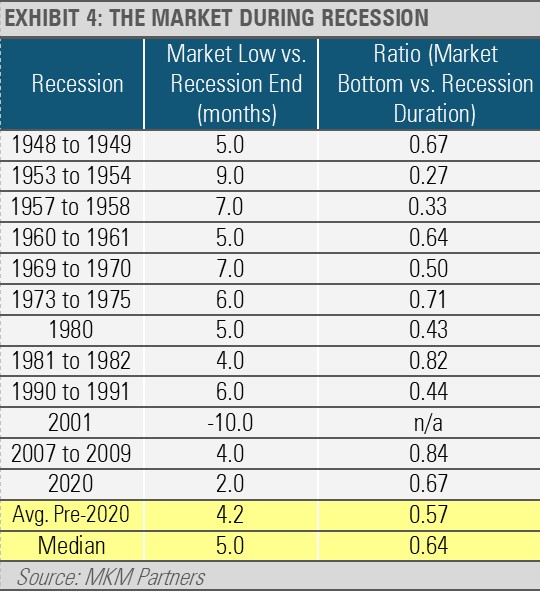
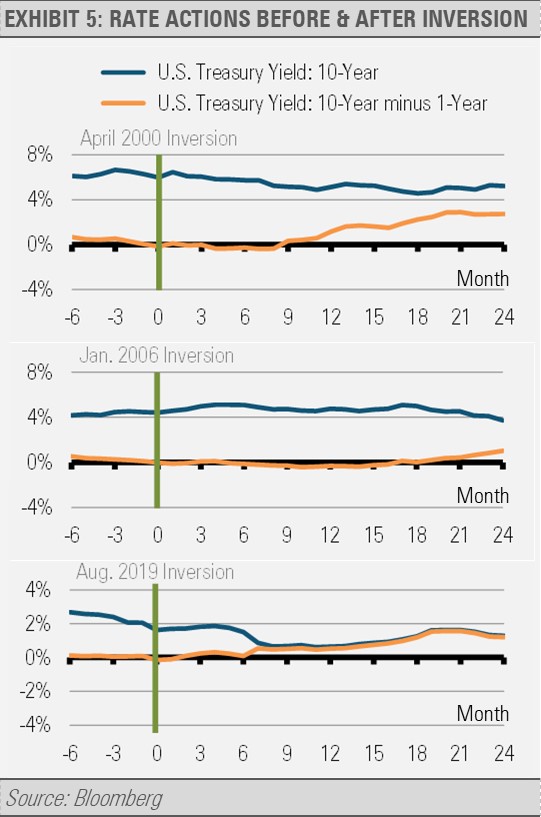
In short, equity market recoveries typically begin months before investors feel better about the economy and markets. While the Fed will likely continue to push short-term interest rates higher, we expect that most of the move higher in long-term interest rates is behind us. Our work suggests that long-term interest rates are likely to decline over the coming year or two as expectations for economic growth and inflation decrease.
For example, current long-term interest rates are lower than short-term rates, which creates an inverted yield curve. Historically, long-term interest rates fall over the coming year or two after the yield curve inverts as it has recently (exhibit 5). Given the economic weakness that we anticipate, investors may become more concerned about the economic environment and corporations’ abilities to service their debt. Treasury bonds, in turn, may benefit from a flight to quality.
INVESTMENT IMPLICATIONS
Our Strategies have become more defensive as we seek to protect from the risks associated with a potential recession and Fed rate hikes while adding positions that may benefit from the environment we see ahead. Our overall allocations are generally underweight traditional equity and overweight traditional fixed income and alternative investments. Our equity and fixed income allocations are mostly defensive in nature and high quality including the health care and consumer staples equity sectors as well as U.S. Treasury bonds. Our alternative investment exposures are broadly diversified across managed futures, master limited partnerships (MLPs), and hedged equity ETFs.
By following a defined process for navigating a risky world, we think investors can feel more confident that they can ride through the turbulence to arrive at their desired financial destination. Recessions and bear markets are part of economic and market cycles. They do not last forever. Investors can use these turbulent times to find new opportunities so long as they follow a disciplined process. Remember that nothing good comes from panic, and our Three Layers of Risk Management can help manage risks in real time.
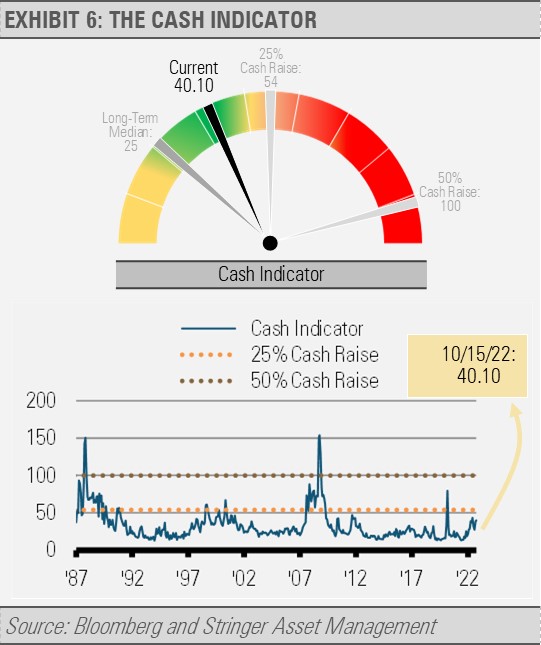
THE CASH INDICATOR
The Cash Indicator (CI) has elevated, but not to a level that suggests a market panic or liquidity crunch is likely in the near term. Rather, the CI reflects greater uncertainty about the future, and not a market crash. If the CI’s level becomes more elevated, we are prepared to take further defensive actions.
DISCLOSURES
Any forecasts, figures, opinions or investment techniques and strategies explained are Stringer Asset Management, LLC’s as of the date of publication. They are considered to be accurate at the time of writing, but no warranty of accuracy is given and no liability in respect to error or omission is accepted. They are subject to change without reference or notification. The views contained herein are not to be taken as advice or a recommendation to buy or sell any investment and the material should not be relied upon as containing sufficient information to support an investment decision. It should be noted that the value of investments and the income from them may fluctuate in accordance with market conditions and taxation agreements and investors may not get back the full amount invested.
Past performance and yield may not be a reliable guide to future performance. Current performance may be higher or lower than the performance quoted.
The securities identified and described may not represent all of the securities purchased, sold or recommended for client accounts. The reader should not assume that an investment in the securities identified was or will be profitable.
Data is provided by various sources and prepared by Stringer Asset Management, LLC and has not been verified or audited by an independent accountant.
