
By the BCM Investment Team
We’d like to start by wishing our readers a happy and healthy New Year. When we wrote our last quarterly letter the U.S. was in the midst of a wave in Covid-19 cases driven by the Delta variant. At the time, we had hoped it would be one of the last major waves as Covid-19 continued along the path to becoming an endemic disease. Then the Omicron variant emerged. Fortunately, the Omicron variant does seem to be milder than the Delta variant that came before it. Unfortunately, it is far more contagious and successfully evades acquired immunity from both vaccines and prior infection. Taken together, these attributes have led to an unprecedented number of cases and the ensuing societal disruptions but hopefully accelerated the virus’ move towards endemic circulation. The emergence of the Omicron variant was certainly an unexpected development, but we remain optimistic that we are approaching the functional end of the pandemic.
Coronavirus in the U.S.: Latest Map and Case Count
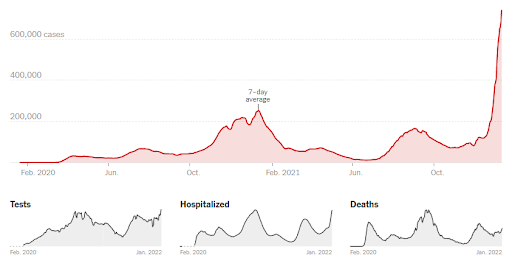
Source: The New York Times Coronavirus Map and Cases (U.S.), as of 1/11/2022.
Moving on to the markets, although it wasn’t necessarily apparent in the major indices, there seemed to be a shift in sentiment during the quarter. Since March of 2020, speculation has been rampant in many corners of the market. We’ve touched on it in past letters, but only briefly because the speculative areas have little overlap with our investment universe. Meme stocks, SPACs, software-as-a-service (SAAS), electric cars, cryptocurrencies, and non-fungible tokens (NFTs) are but a few examples. While there is some overlap among these themes, there is only one commonality across all of them: the expectation of making life changing sums of money in a short period of time. This is fundamentally the basis of all speculation. As long as marginal investors believe they too can participate in potential life changing gains, the speculative fever continues.
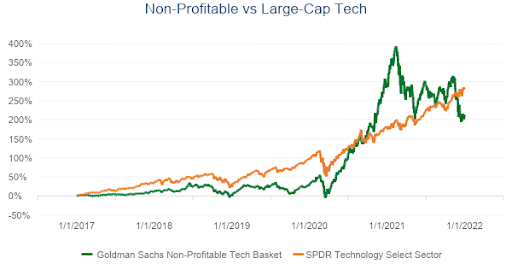
Source: Goldman Sachs Marquee, Bloomberg for the period 1/1/2017 through 12/31/2021.
The speculative fever was most pronounced from March of 2020 to February of 2021. As an example, over that time frame the Goldman Sachs Non-Profitable Tech Basket returned over 400%. Since then, this particular basket has struggled, but other themes took up the mantle and continued to march higher. This brings us to the fourth quarter, when it seems that sentiment turned simultaneously on many of these speculative areas in the market. Companies with billions of dollars in market cap fell by 50-70% in a matter of weeks. As of the end of the year, 40% of the companies in the NASDAQ composite were down over 50% from their 52-week high. The last time this occurred with the composite remaining at an all-time-high was the peak of the tech bubble in 2000. This phenomenon occurs as investors sell their speculative stocks and pile into the largest companies which retain their positive momentum, giving us the phrase “the generals always get shot last.”
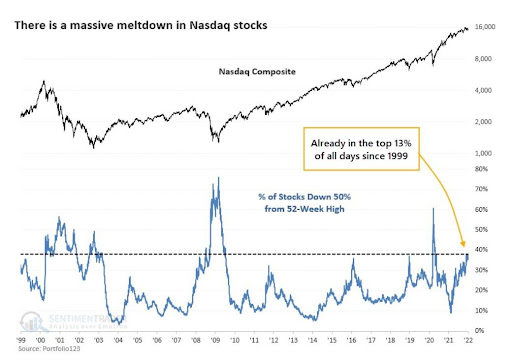
Source: @GavinSBaker from 1/7/2022.
The big unanswered question is whether this disruption will spill over to the broader market—”will the generals get shot?”. So far that has yet to occur, and perhaps this is just a healthy rotation away from the most overvalued companies and into some of the best businesses in the world. We’ve been careful to avoid the word “bubble” when describing this phenomenon because it’s truly difficult to determine a bubble without the benefit of hindsight. In 2000, Microsoft traded at nearly 80x forward earnings while the 10-year treasury rate was around 6%. Fast forward to today and Microsoft trades at 35x forward earnings with the 10-year treasury rate just under 2%. We know that the first price is wrong1 because we have the benefit of hindsight, but only time will tell for the second.
Whether the price is right or wrong, there’s no denying that interest rates are low and market multiples are high. The Atlanta Fed’s GDPNow estimate for real GDP in the fourth quarter is currently 6.8% annualized, year-over-year Consumer Price Index (CPI) growth in December was 7.0% annualized, and wages are growing at an annualized rate of nearly 5%. Does a sub-2% 10-year treasury rate make sense long-term given this macroeconomic backdrop? The Federal Open Market Committee (FOMC) certainly believes that a 0% federal funds rate is too low, and they’ve telegraphed four rate hikes in 2022 along with a continued tapering of Quantitative Easing (QE).
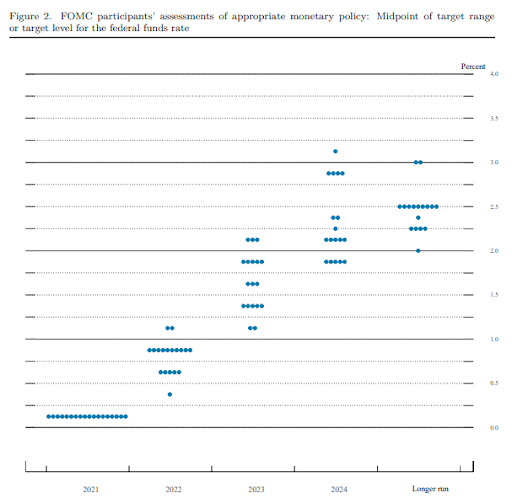
Source: The Federal Reserve Summary of Economic Projections, 12/15/2021.
The markets almost seem balanced on the head of a pin. The expectation is that higher growth and inflation in the short-term will force the Federal Reserve (Fed) to adopt more restrictive monetary policy, restricting long-term growth and inflation which justifies lower interest rates. That may seem like an unstable equilibrium of sorts, but this was the prevailing regime from 2009 up until about 2017. Between 2017 and 2019, the last time the Fed embarked on a serious rate hike campaign, rate-sensitive economic activity—such as home-buying—slowed, long-term rates didn’t budge, and the yield curve flattened. Shortly after, the Fed responded by lowering rates back in line with market expectations.
If the last paragraph seems somewhat confusing, it’s because the current market environment is extremely confusing. The future is uncertain, but market prices seem to project a certainty that most investors would deem imprudent. It’s important for us to convey that we do not know what the future will bring, but as quantitative managers we benefit from insights generated by the statistical analysis of decades of market data. Nearly every statistical measure of market performance is at or near a historical extreme. Our forward-looking systems believe that caution is warranted, and the fundamental investor in us tends to agree. This is far from a pronouncement of gloom and doom, simply a call for caution. We believe that our quantitative systems give us the best chance of successfully navigating the uncertain market environment that lays ahead.
As always, we thank you for your business and trust, and we look forward to navigating these ever-shifting market environments.
This article was contributed by the Investment Team at Beaumont Capital Management (BCM), a participant in the ETF Strategist Channel.
For more insights like these, visit BCM’s blog at blog.investbcm.com.
For more news, information, and strategy, visit the ETF Strategist Channel.
Sources and Disclosures:
Interest rates are important context for comparing these two valuations and make it clear that there is a larger relative difference than even the price-to-earnings (PE) ratio would indicate. You can convert a PE ratio to an “earnings-yield” for better comparison. Microsoft’s 80x PE ratio is a 1.25% earnings yield, producing an “equity risk premium” of -4.75% vs a 6% treasury yield. Microsoft’s equity risk premium today is 0.8%. From here the logic may be somewhat convoluted but converting the spread between the two equity risk premiums back into a ratio suggests an 18x difference in relative valuation.
Copyright © 2021 Beaumont Capital Management LLC. All rights reserved. All materials appearing in this commentary are protected by copyright as a collective work or compilation under U.S. copyright laws and are the property of Beaumont Capital Management. You may not copy, reproduce, publish, use, create derivative works, transmit, sell or in any way exploit any content, in whole or in part, in this commentary without express permission from Beaumont Capital Management.
Past performance is no guarantee of future results. Index performance is shown on a gross basis and an investment cannot be made directly in an index. The performance of any ETFs, as contributors or detractors to the strategy, are provided on a gross basis. An Exchange Traded Fund (ETF) is a security that tracks an index, a commodity or a basket of assets like an index fund, but trades like a stock on an exchange. ETFs experience price changes throughout the day as they are bought and sold. All BCM strategies invest only in long-only ETFs.
This material is provided for informational purposes only and does not in any sense constitute a solicitation or offer for the purchase or sale of a specific security or other investment options, nor does it constitute investment advice for any person. The material may contain forward or backward-looking statements regarding intent, beliefs regarding current or past expectations. The views expressed are also subject to change based on market and other conditions. The information presented in this report is based on data obtained from third party sources. Although it is believed to be accurate, no representation or warranty is made as to its accuracy or completeness.
As with all investments, there are associated inherent risks including loss of principal. Stock markets, especially foreign markets, are volatile and can decline significantly in response to adverse issuer, political, regulatory, market, or economic developments. Sector and factor investments concentrate in a particular industry or investment attribute, and the investments’ performance could depend heavily on the performance of that industry or attribute and be more volatile than the performance of less concentrated investment options and the market as a whole. Securities of companies with smaller market capitalizations tend to be more volatile and less liquid than larger company stocks. Foreign markets, particularly emerging markets, can be more volatile than U.S. markets due to increased political, regulatory, social or economic uncertainties. Fixed Income investments have exposure to credit, interest rate, market, and inflation risk.
Diversification does not ensure a profit or guarantee against a loss.
The Standard & Poor’s (S&P) 500® Index is an unmanaged index that tracks the performance of 500 widely held, large-capitalization U.S. stocks. Indices are not managed and do not incur fees or expenses. The S&P Small Cap 600® Index is an unmanaged index that tracks the performance of 600 widely held, small-capitalization U.S. stocks. The MSCI World Index is a free float-adjusted market capitalization weighted index that is designed to measure the equity market performance of developed markets. The MSCI World ex-U.S. Index is a free float-adjusted market capitalization weighted index that is designed to measure the equity market performance of developed markets, excluding the United States. The MSCI ACWI Index captures large and mid-cap representation across 23 Developed Markets and 26 Emerging Markets countries. The MSCI ACWI Index ex-U.S. captures large and mid-cap representation across 22 Developed Markets and 26 Emerging Markets countries, excluding the United States. The Bloomberg Barclay’s U.S. Aggregate Bond Index is a broad base index and is often used to represent investment grade bonds being traded in the United States. Goldman Sachs Non-Profitable Technology Index consists of non-profitable U.S. listed companies in innovative industries. Tech is defined quite broadly to include new economy companies across GICS industry groupings. The basket is optimized for liquidity with no name initially weighted greater than 4.65%. The Technology Select Sector SPDR® Fund seeks to provide investment results that, before expenses, correspond generally to the price and yield performance of the Technology Select Sector Index (the “Index”). The Index seeks to provide an effective representation of the technology sector of the S&P 500 Index.
“S&P 500®”, and “S&P Small Cap 600®” are registered trademarks of Standard & Poor’s, Inc., a division of S&P Global, Inc. MSCI® is the trademark of MSCI Inc. and/or its subsidiaries.
Please contact your BCM Regional Consultant for more information or to address any questions that you may have.
Beaumont Capital Management was originally created in 2009 as a separate division of Beaumont Financial Partners, LLC. Beaumont Capital Management LLC spun off as its own entity as of 1/2/2020. Beaumont Financial Partners, LLC was originally registered as Beaumont Trust Associates in 1981 and was reorganized into Beaumont Financial Partners, LLC in 1999.
Beaumont Capital Management LLC
75 2nd Ave, Suite 700, Needham, MA 02494 (844-401-7699)
