
The general markets have been a whirlwind of investor emotion. So far in 2022, the S&P 500 has experienced 6 outlier days (a day beyond +/-1.50%). At one point in January, the S&P 500 had been down -12% off its peak. Within the last 2 weeks, there was a 4-day period where the index rose +6%, before falling -2.44% a day later. Other indexes, like the Russell 2000, are off by close -20% from its high. Bottom line—volatility in the markets is rising.
High volatility, in both directions, is a negative and irrational market characteristic. Investors want markets to have low or decreasing volatility, not high and increasing. There are many sayings when it comes to dealing with the markets and the various environments they can throw at investors. Most people have probably heard phrases such as “it’s about time in the markets, not timing the markets” or “if you miss the 10 largest up-days in the markets, you’re done.” Here is the part that these phrases avoid: the 10 biggest up-days happen in the same type of environment as the 10 largest down-days. Spoiler alert, it’s not the rational kind of environment.
Here is a quick Canterbury study on the largest up-days in the market versus the largest down-days in the market, and which type of market environment each occurs. Our team took readily available S&P 500 daily data going back to 1950. We pulled out the top 50 largest up-days in the market and 50 largest down-days in the market. You can see in the table below, the largest up days and down days are about even across the board, with the average of the 100 chosen days being close to 0%.
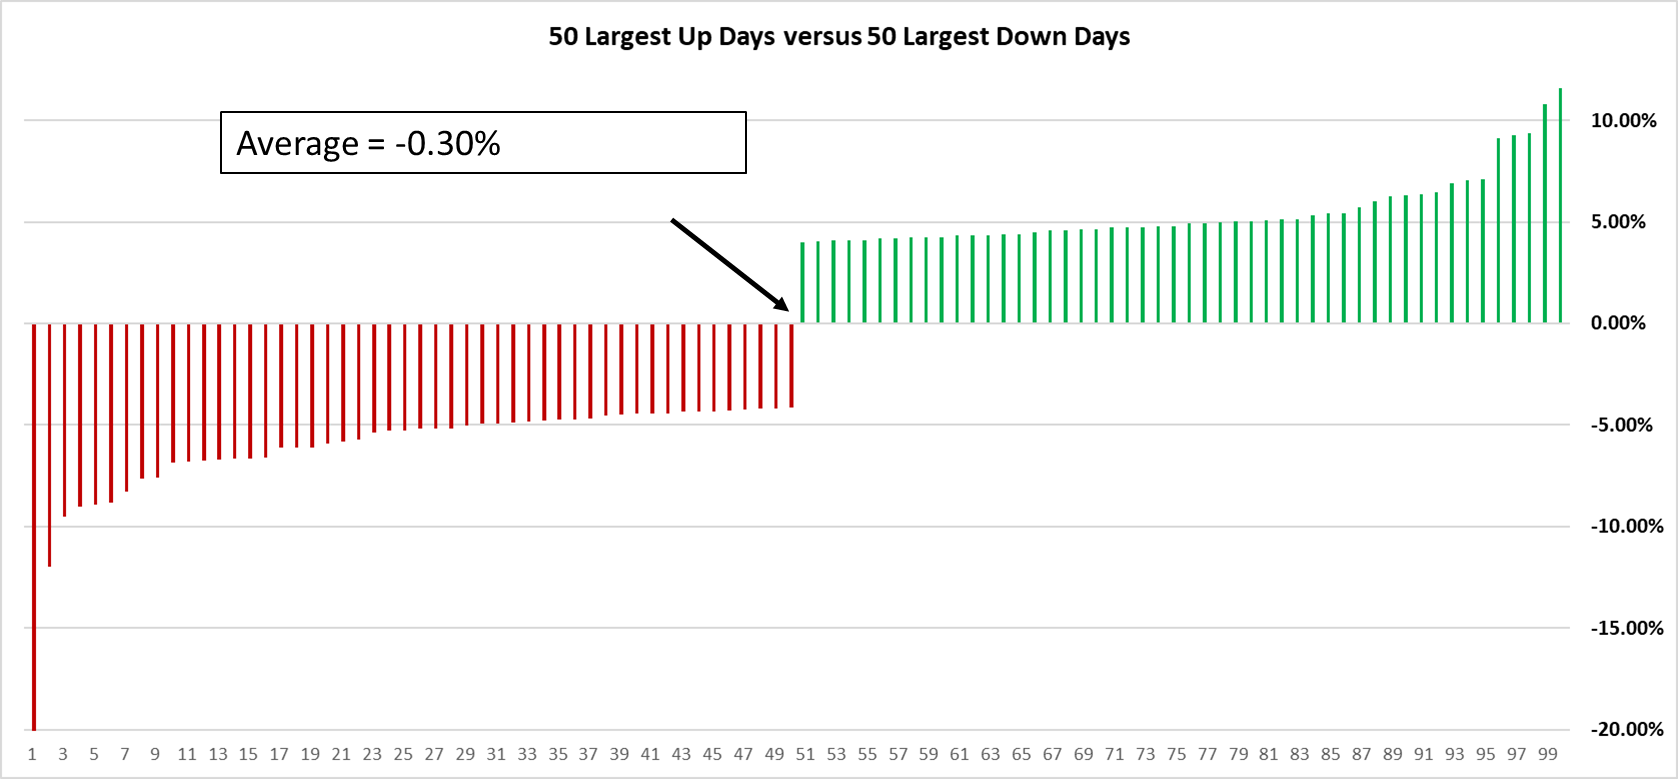
Source: Canterbury Investment Management, daily data from Yahoo Finance
The chart below shows the S&P 500 dating back to 1950. We overlayed the Canterbury Market State Environments, which are measured each day, to distinguish were markets were low risk (green), high risk (red), or transitional (risk either rising or falling; yellow).
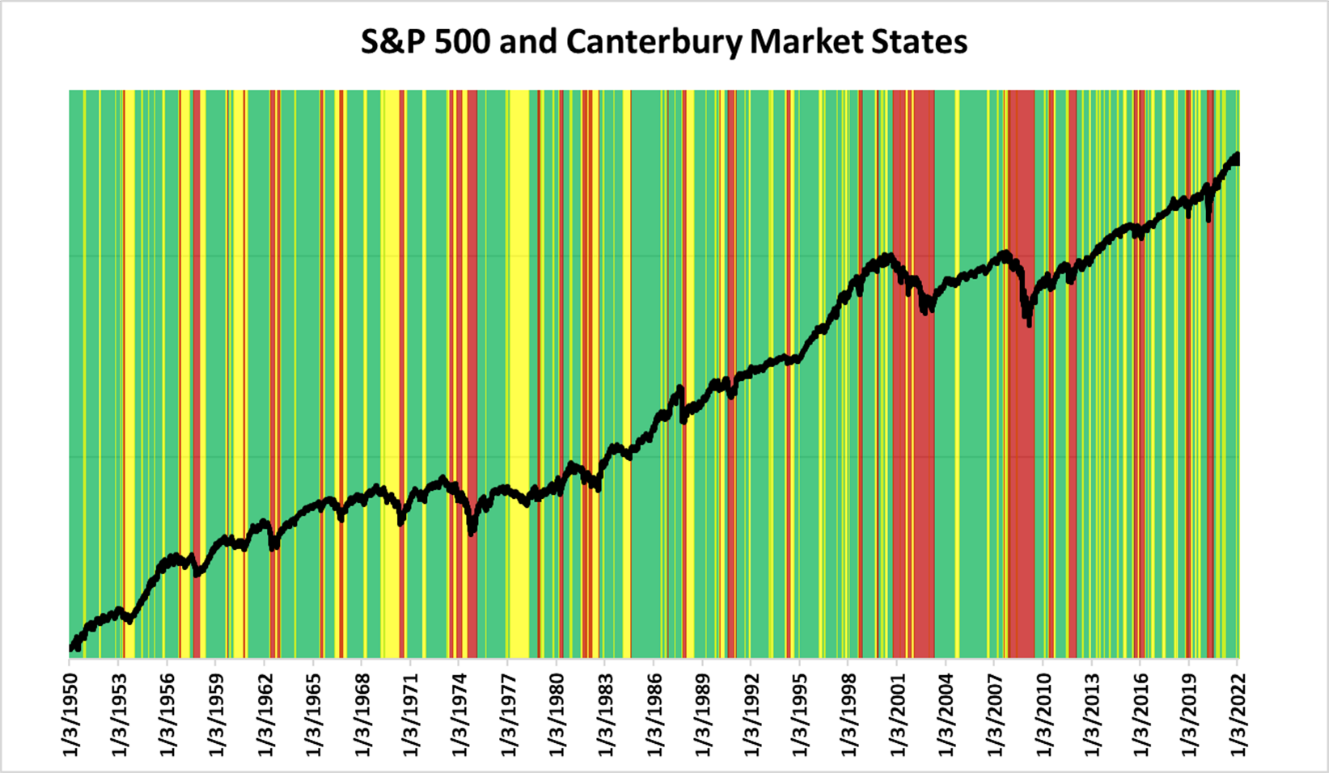
Source: Canterbury Investment Management, daily data from Yahoo Finance
Next, we took those same market environments, and this time, showed all of the daily fluctuations. Notice that in “red” high risk market environments, the daily fluctuations are much larger and go in both directions, up and down. In the “green”, low risk environments, the daily fluctuations are much tighter.
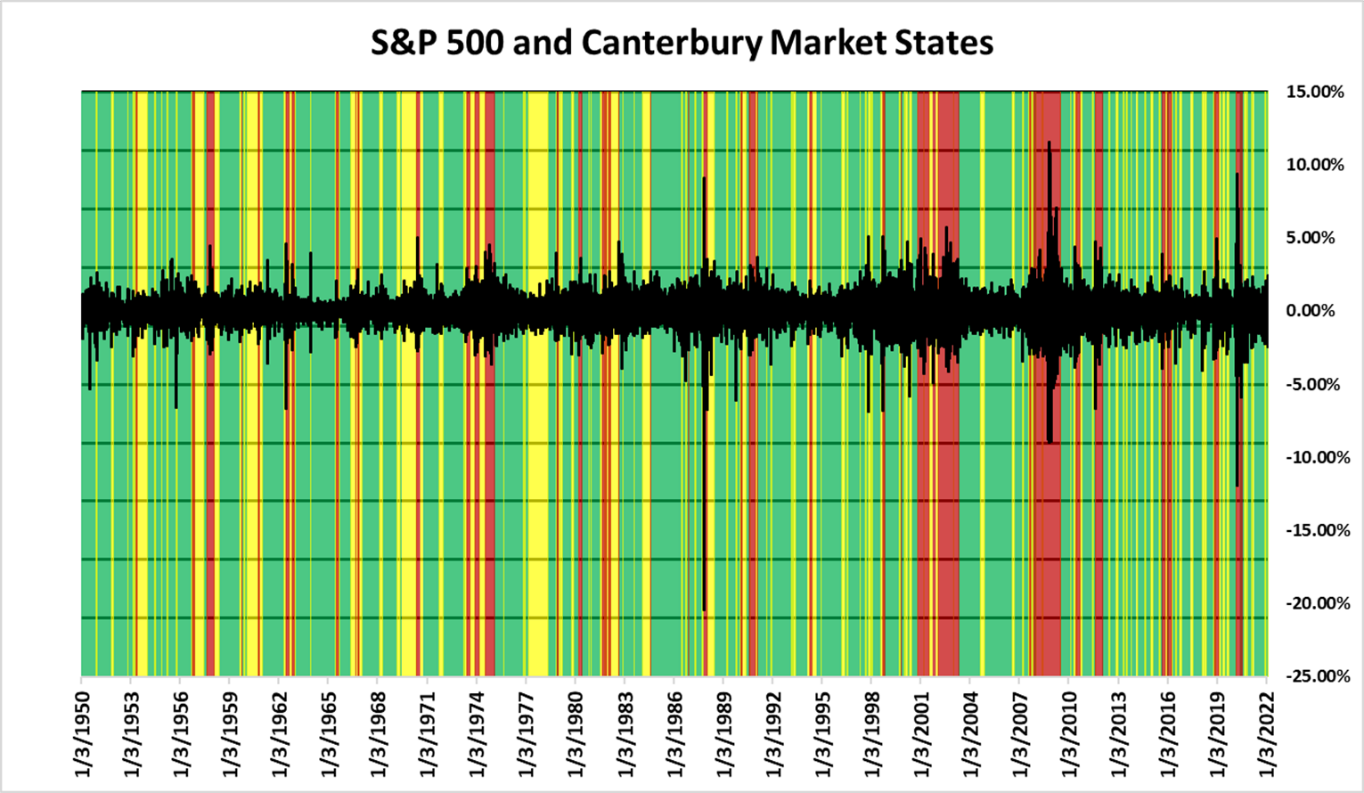
Source: Canterbury Investment Management, daily data from Yahoo Finance
Now it is time to put this all together. Our first chart showed the 50 largest up-days and 50 largest dow-days; the next chart showed the various Canterbury market environments and risk in those environments; and the last chart showed those same market environments with the daily fluctuations of the market. Remember, they say if you miss the 10 largest up days in the market, you fall way behind. Here is the kicker, the 10 largest up days happen in the same environment as the 10 largest down days.
Out of the 50 largest up days and 50 largest down days (100 days total):
- 86 of them occurred in a high risk (volatile) market environment
- 12 occurred during a transitional market environment
- Only 2 occurred during a low risk (low volatility) market environment
As an additional statistic, if a portfolio only experienced the 50 largest up-days in the market and 50 largest down-days, that portfolio would be down about -40%, even though the largest up-days and largest down-days are fairly close in average.
Bottom Line
So, they say you cannot afford to miss the largest up days in the market. This phrase makes the assumption that you have also participated in the largest down days. We know from the study above that both the largest up-days and largest down-days occur in the same type of environment- a highly volatile one. Volatile markets are irrational and will experience large outliers in both directions. The bottom line is that efficient portfolio management requires a process for navigating volatile markets, outside of just riding the market through them.
This is the issue with a buy and hold strategy. Buying and holding a fixed allocation subjects an investment portfolio to riding all the waves and fluctuations of the markets. As volatility in the markets increase, correlations increase, and a fixed asset allocation will eventually become a reflection of the volatile market environment. It can subject investors to experiencing these large outlier days, with their only options being to hold on tight.
At Canterbury, we practice adaptive portfolio management. Adaptive portfolio management involves adjusting the portfolio’s holdings and allocations to maintain efficient diversification and low volatility. The goal is to limit and tighten the portfolio’s daily fluctuations and therefore limit the large declines that can be experienced during bear markets.
