
Talking Points: Recent Velocity from Stringer Asset Management on Vimeo.
The recent market volatility is enough to unsettle even the most stoic investors. Our work suggests that while volatility may continue and we may not have seen the bottom of the current pullback, this volatility represents an excellent buying opportunity. We are not calling a bottom here, but we are optimistic about a stock market recovery in the coming weeks.
History shows that periods of market complacency and below average volatility tend to be followed by periods of higher volatility and market corrections, such as we are witnessing today. This type of market action tends to occur approximately every 18 months.
First, as long as the fundamental backdrop remains strong, selloffs recover quickly. We discussed this recovery phenomenon in a piece that we wrote in response to the quick and intense equity selloff at the end of 2018. To summarize, the average market pullback, which is a decline of -5% to -10%, took approximately 42 days to reach a bottom and 43 days to recover to its previous level. Whereas the average correction, which is a decline of -10% to -20%, took 50 days to bottom and 49 days to recover. In short, unless it’s a true bear market decline of more than 20%, which is usually associated with a recession, the fall is fast, and the bounce is equally as intense.
The current economic setup suggests a very little chance of recession and, therefore, favors a strong market recovery. Despite challenges from omicron, upcoming rate hikes by the U.S. Federal Reserve from a position of being well behind the curve, and acute geopolitical threats, the U.S. economy has rarely been in a stronger position. Additionally, recent data suggests that private sector is wealthier than ever.
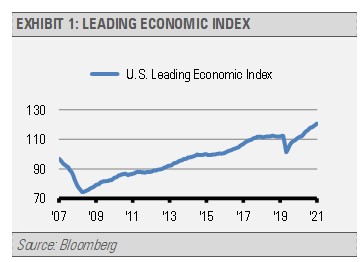
The Conference Board Leading Economic Indicators, which has accurately forecasted both economic recessions and growth for years, continues to push higher. Ataman Ozyildirim, Senior Director of Economic Research at The Conference Board, stated regarding the latest reading “The U.S. LEI ended 2021 on a rising trajectory, suggesting the economy will continue to expand well into the spring1.” (The Conference Board, 2022). In fact, of our internal dashboard of recession indicators, including industrial metals price trends, the yield curve, and layoffs, none are showing signs of heightened recession risk.
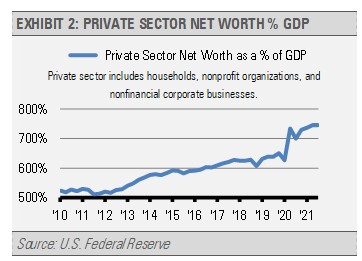
Secondly, consider the strength of the U.S. private sector, which includes households and non-financial corporations. In both absolute terms and relative to the size of the U.S. economy, private sector net worth, which is assets minus liabilities, is at an all-time high while the U.S. economy is now larger than ever and has fully recovered from the pandemic-induced recession.
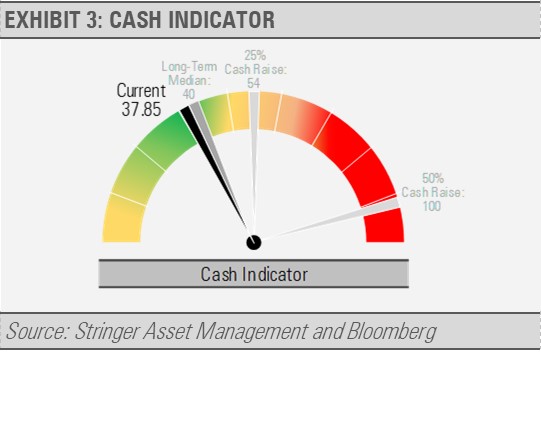
Finally, our Cash Indicator (CI) has been a reliable tool in helping us differentiate between systematic market breakdowns and normal, albeit high, volatility. Our CI remains within its normal range. The CI suggests that markets continue to function properly, and we are not nearing crisis levels of market stress.
Our work suggest that the relevant questions are when and what to buy. We continue to favor the financials, health care, and information technology sectors, in addition to global natural resources. With a strong likelihood of a quick rebound, these purchases could be timely.
In summary, our work suggests that the recent market volatility may be a 90–100-day event and may represent and excellent buying opportunity that we have not seen for some time.
Please see our 2022 Annual Outlook video here: https://vimeo.com/669344566 for more information and contact us if there is anything we can do for you.
1The Conference Board. (2022, January 21). The Conference Board Leading Economic Index® (LEI) for the U.S. Increased in December [Press release]. Retrieved from https://www.conference-board.org/topics/us-leading-indicators/press/us-lei-jan-2022
DISCLOSURES
Any forecasts, figures, opinions or investment techniques and strategies explained are Stringer Asset Management, LLC’s as of the date of publication. They are considered to be accurate at the time of writing, but no warranty of accuracy is given and no liability in respect to error or omission is accepted. They are subject to change without reference or notification. The views contained herein are not be taken as an advice or a recommendation to buy or sell any investment and the material should not be relied upon as containing sufficient information to support an investment decision. It should be noted that the value of investments and the income from them may fluctuate in accordance with market conditions and taxation agreements and investors may not get back the full amount invested.
Past performance and yield may not be a reliable guide to future performance. Current performance may be higher or lower than the performance quoted.
Data is provided by various sources and prepared by Stringer Asset Management, LLC and has not been verified or audited by an independent accountant.
