
SUMMARY
2022 began with a lot of uncertainty. Given the sharp decline and “sell the rally” mindset, besides looking for price stability (base building), we are following our sentiment, oversold, new lows, and breadth thrust indicators, which suggest the worst is close at hand or over.
What We Do Know (Indicators, Observations, & Experience)
We counseled identifying risk tolerance levels and managing risk going into year-end 2021 and 2022, and to expect an increase in equity market volatility for the better part of the past four to six weeks. The tape action last week and year-to-date has been unmerciful. The “Generals” (predominantly narrow-based equity market indices) finally caught up to the “Troops” (broad market) and left the party via across-the-board selling. The value/cyclical- oriented Dow Jones Industrial Average (DJIA) fell 4.60% last week. The technology-heavy S&P 500 (SPX) and NASDAQ ended the week down 5.68% and 7.55% respectively. A Small-Cap proxy (IWM) fell just over 8% last week. Year-to-date, the DJIA, SPX, IWM, and NASDAQ have fallen 5.70%, 7.73%, 11.45% and 11.99% respectively. The year-to-date declines by many individual stocks, industry groups, sectors, and certain “risk-on” proxies (cryptocurrencies, SPACS, IPO, meme) has been even more brutal.
- All large losses begin as small losses. ~Ned Davis
- The stock market deals in probabilities and not 100% certainty. Day Hagan prefers to overweight statistical probability and underweight emotion. Please reach out for details.
- Stock Market Declines (please refer to slide five from last week’s webinar): We know from a study by Ned Davis Research that between 1/3/1928 and 1/10/2022 the SPX experiences on average three 5% or more declines every year. It experiences one 10% or more decline on average every year (last occurrence 2/19/2020), and one 15% or more decline on average every two years—last occurrence 2/19/2020. The study further points out that the SPX experiences one 20% or more decline every three years—last occurrence 2/19/2020. Any additional downside volatility this year is consistent with NDR’s study.
- Sentiment—short term (charts not included, please reach out): Sentiment extremes will play a role in igniting short-term moves in the equity markets during 2022—volatility in both directions. Regardless of whether you look at NDR’s Daily Trading Composite, survey readings (Investor’s Intelligence, NAAIM, AAII), or the news media, a lot of pessimism currently exists. Put-Call readings are close but not quite there. Since sentiment is a contrarian indicator (a lot of pessimism is bullish because it implies a lot of selling has been occurring), sentiment readings are moving in the right direction.
- Note: Sentiment extremes in and of themselves don’t cause a directional change in the equity market. What they suggest in this case, given the pessimism in place, is that there is a lot of potential energy stored up, which can help the market rebound as investors and traders sitting on the sidelines turn into buying pressure as they see a reversal higher taking place without them—a catalyst is needed, and fear quickly turns to greed.
- Oversold levels (charts not included, please reach out): For this analysis I viewed the McClellan Oscillator, a deviation from mean chart; RSI, a rate of change chart; percentage of stocks above 10-day MA (short-term); and 20-day EMA (short-term). Within the context of the note below, short-term Small-Cap, Mid-Cap, and NASDAQ types—but not Large Caps—are at or very close to levels that suggest a bounce should occur. The quality of any bounce is critical—see Breadth Thrusts below. This is not the case in the intermediate term (percent of stocks above 50-day MA, weekly stochastics, NYSE New Highs minus New Lows–Cumulative)—more work is needed. Long-term (percentage above 200-day MA) is not close.
- Note: To paraphrase an excellent observation by Tom McClellan, an oversold reading in an uptrend should be enough to halt the decline. You can know you are in a downtrend when oversold readings fail to stop a decline (and when bullish signals don’t produce rallies).
- New 52-Week Lows (please reach out for charts): Spike readings help identify selling exhaustion. While the number of New Lows is getting “spiky” in the Large-Cap, Mid-Cap, and Small-Cap complex (good in the short term), they are not near levels recorded at significant previous, COVID-unrelated lows from 2011, 2015-2016, and late 2018. Concerning the NASDAQ, the current readings are extreme and above those from 2011, 2015-2016, and late 2018, but far below 2020 readings. With any type of positive catalyst, NASDAQ and related could experience a sharp short-term bounce higher.
- Breadth Thrusts: Since it is impossible to predict the ultimate level that attracts high conviction buying, evidence of strong demand (breadth thrusts, Advancing Volume over Declining Volume, etc.) is historically a reliable method of identifying equity market stability, a low/bottom, and ultimately a new uptrend. While these could occur at any point, none has—as my wife says to me, “Hello, Captain Obvious.” When they occur and the market proves itself, we will let you know.
More observations:
- “A tape that is up in the morning and down in the afternoon,” which is what occurred last week, is not healthy and can be used as a guidepost (thank you, JDS) because it implies a change in mindset.
- The overarching story has been how the Fed is changing investor behavior. The combination of ending QE, beginning QT, and rate hike liftoff has left equity investors with significant uncertainty. ~J.P. Morgan.
- This week’s FOMC meeting becomes a market focus as the Fed’s execution plan will hopefully become clearer. The Fed is expected to leave short-term interest rates unchanged but will likely hint at a March hike, per Raymond James & Associates Chief Economist Dr. Scott Brown.
- The equity market takes the stairs up (slow and methodical, though not always logical) and the elevator down (the emotion of fear causes fast and in certain cases panicky/illogical reactions—selling).
What We Don’t Know
“The need for certainty is the greatest disease the mind faces,” says author and public speaker Robert Greene. Selling stampedes and fear (1-800-GET-ME-OUT) make it difficult to know with 100% certainty where the selling will end. What we can do is follow our models and indicators, as discussed above, while using the charts to look for areas, trendlines, measured moves, etc., which in the past have helped in identifying where downside selling may be contained. See Figures 1-4.
Figure 1: S&P 500 Large Cap Index (SPX). | Areas of support (levels of theoretical buying interest) depicted by green rectangle, resistance (selling pressure) by red highlights.
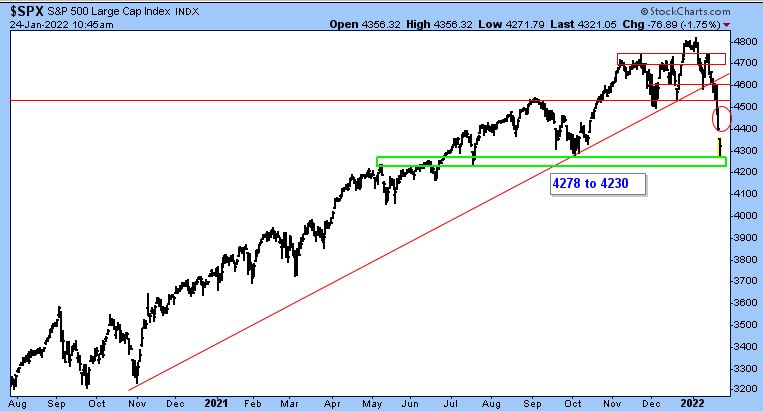
Figure 2: Dow Jones Industrial Average (DJIA). | Areas of support depicted by green line and orange arrows, resistance by red highlights.
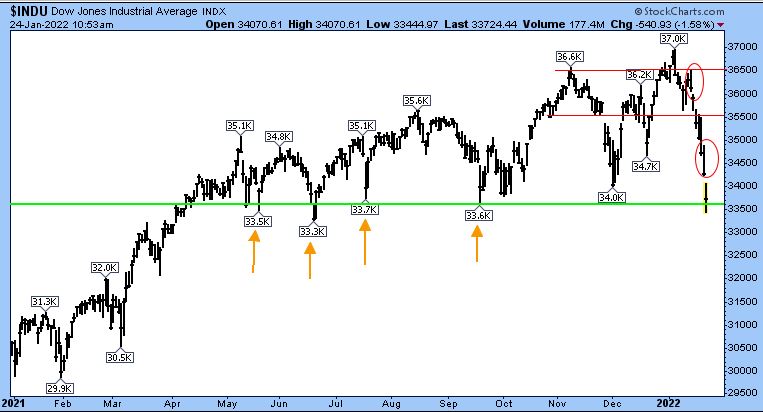
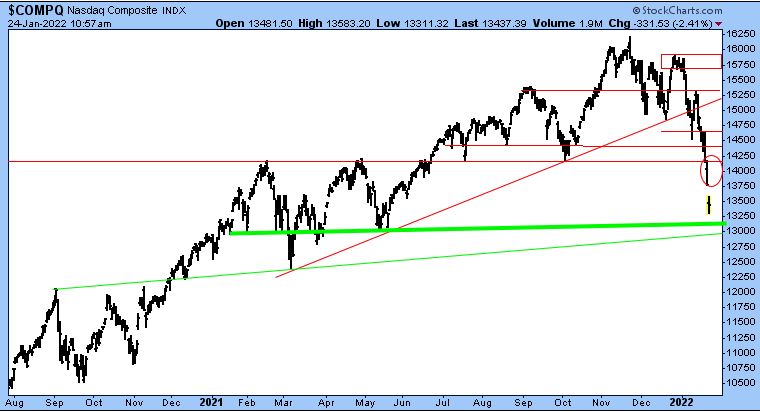
Figure 3: NASDAQ Composite (COMPQ). | NASDAQ gave up approximately six months of gains in three weeks! Stairs up and elevator down. This chart looks parabolic, but to the downside. Therefore, any type of positive catalyst may lead to a huge short squeeze. Areas of support highlighted by green lines, resistance by red highlights.
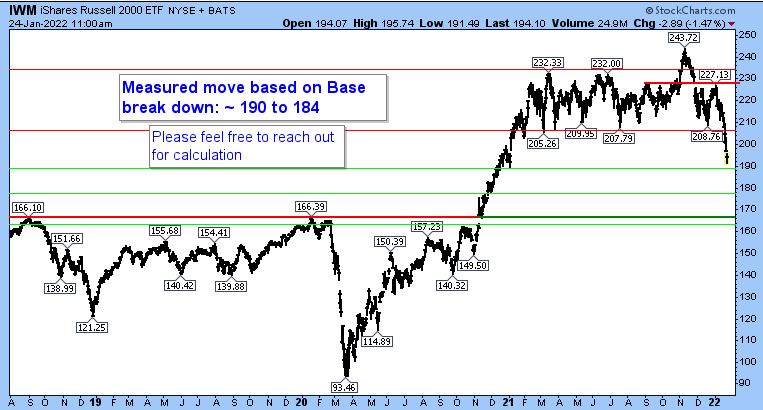
Figure 4: iShares Russell 2000 ETF (IWM). | Areas of support depicted by green lines, resistance by red lines. Like NASDAQ, this chart looks parabolic, but to the downside. Therefore, any type of positive catalyst may lead to a huge short squeeze.
Day Hagan Asset Management appreciates being part of your business, either through our research efforts or investment strategies. Please let us know how we can further support you.
Art Huprich, CMT®
Chief Market Technician
Day Hagan Asset Management
—Written 01.22-23.2022. Chart source: Stockcharts.com unless otherwise noted.
Disclosure: The data and analysis contained herein are provided “as is” and without warranty of any kind, either express or implied. Day Hagan Asset Management (DHAM), any of its affiliates or employees, or any third-party data provider, shall not have any liability for any loss sustained by anyone who has relied on the information contained in any Day Hagan Asset Management literature or marketing materials. All opinions expressed herein are subject to change without notice, and you should always obtain current information and perform due diligence before investing. DHAM accounts that DHAM, or its affiliated companies manage, or their respective shareholders, directors, officers and/or employees, may have long or short positions in the securities discussed herein and may purchase or sell such securities without notice. The securities mentioned in this document may not be eligible for sale in some states or countries, nor be suitable for all types of investors; their value and income they produce may fluctuate and/or be adversely affected by exchange rates, interest rates or other factors.
Investment advisory services offered through Donald L. Hagan, LLC, a SEC registered investment advisory firm. Accounts held at Raymond James and Associates, Inc. (member NYSE, SIPC) and Charles Schwab & Co., Inc. (member FINRA, SIPC). Day Hagan Asset Management is a dba of Donald L. Hagan, LLC.
