
One week into the new year, and a new year has brought new market leadership. A theme we saw in the last 8 months of 2021, and consistently in the last several years, was that growth-oriented stocks had led the markets. A growth-oriented stock would typically be associated with technology-related securities, which make up the largest component of the S&P 500 index and many other broad market indexes.
Just two weeks ago, we mentioned that we were beginning to see a rotation in the markets. On a risk-adjusted basis, technology-oriented sectors were falling down the ranks, while more “defensive” sectors like Utilities and Staples were climbing. The first week of the new year continued that trend. While the broad markets were generally down for the week, S&P 500 Large Cap Value outperformed S&P 500 Large Cap Growth by 5.5%. This was led by Consumer Staples, Financials, and Energy, with the latter two getting a considerable bounce off of the low points.
Technology & growth-oriented stocks, on the other hand, have not faired too well in recent weeks. The Nasdaq 100, which heavily favors technology-related securities, reached a relative peak on December 28th. In the 9 days since, as of Friday’s close, the index is down -5.85%. The technology index’s lowest volatility level occurred in mid-September and was CVI 56 (Canterbury Volatility Index—56 is almost an extreme low rating). As of Friday, and should continue through Monday, the index’s volatility is above 100, which is high.
This increase in volatility is being led by the market’s largest components. As we stated in a previous update, the largest 9 stocks (8 companies) in the Nasdaq 100 make up 50% of the index’s capitalization, meaning 50% of the index’s movement comes from just those 9 stocks. Collectively, the peak to trough decline of those stocks has been -6.70% from December 28th through Friday. Each stock’s individual peak to trough decline over that timeframe is listed below.
| Company Stock | Nasdaq 100 Weight | Percentage Peak-to-Trough Decline Dec 28-Jan 7 |
| Apple | 11.70% | -3.97% |
| Microsoft | 10.64% | -7.97% |
| Amazon | 7.61% | -4.75% |
| 7.57% | -6.45% | |
| Tesla | 6.08% | -14.40% |
| NVIDIA | 5.32% | -10.34% |
| Meta (Facebook) | 3.31% | -4.17% |
Source: CIM, weights from QQQ holdings, listed on MarketWatch
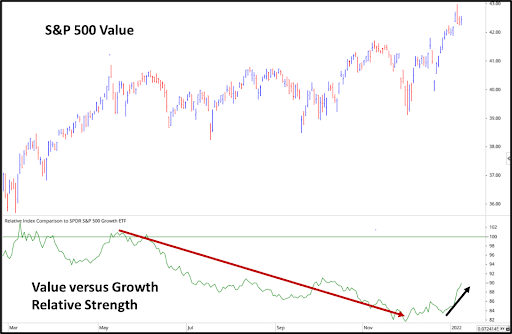
The chart below shows the S&P 500 Value ETF, and its relative strength versus S&P 500 growth. You can see in the chart below, that during the last two weeks, relative strength of value versus growth has increased, meaning value has outperformed growth on a relative basis (and absolute) basis. Prior to the last few weeks, value had underperformed growth for several months.
Source: CIM using Optuma Technical Analysis Charting
Bottom Line
Whenever markets begin to experience larger-than-average trading days, investors can get a sense of nervousness. When we look at the stocks-only advance decline line of the S&P 1500, it has moved sideways over the last few weeks with no clear divergence. That is a good thing. In other words, while volatility on technology stocks has certainly increased and we are starting to see larger trading days, value-oriented stocks have been strong. At this point, this seems to be a normal rotation in market strength. Growth stocks had been strong for several months and were due to decline in relative strength at some point.
Canterbury will continue to monitor the markets for any additional rotations. The Canterbury Portfolio Thermostat has already adapted to some of the value sectors such as Utilities and Staples, and recently took a position in the Value index. Overall, the S&P 500 is still in a bullish Market State.
For more news, information, and strategy, visit the ETF Strategist Channel.
