
We have discussed extensively that technology-related stocks have led the S&P 500. In fact, technology-related stocks make up nearly 45% of the market index’s weighting, causing the index to be substantially out of balance. How did technology come to make up such a large percentage of the market index?
The S&P 500 is not a balanced portfolio, nor a balanced index. It was designed to measure market capitalization of the largest 500 US stocks. Measuring market capitalization causes an index to be a momentum index, meaning the stocks that experience the biggest increases will become larger components of the index.
From 1993 to 1999, we saw the information technology sector grow from representing 6% of the S&P 500 in 1993, to representing 30% of the market in 1999, just 6 years later. This happened due to a parabolic increase in technology stocks, as shown in the charts below comparing the S&P 500 to the Nasdaq 100 index (Technology stocks).
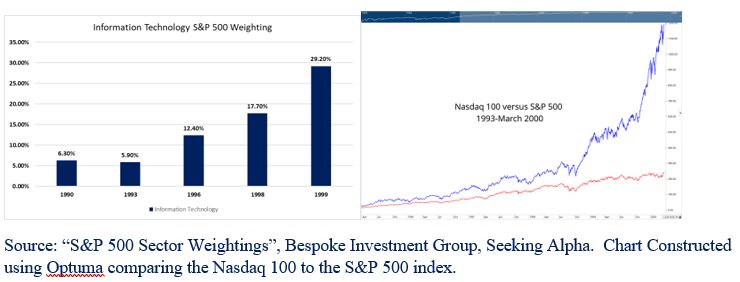
When the technology sector began to experience the substantial outperformance, it represented a small portion of the S&P 500. However, beginning in 2000 at the start of the famous tech-crash, technology-related stocks made up 40% of the index. The decline seen in the Nasdaq (which mostly represents the largest technology stocks) was about 80%. Technology had a large impact on the overall market’s decline due to its large weighting, causing the S&P 500 to fall by more than -50%. Today, we have seen information technology grow from 15% in 2008, to now representing nearly 45% of the S&P 500 when you include communications stocks (Google, Facebook, Netflix) plus Amazon & Tesla.
Nasdaq 100 Breadth
What about the Nasdaq? Does it have a weight problem?
The Nasdaq 100 is a technology-based index. The Nasdaq 100 is composed of a total of 102 securities from 100 unique companies, with most of its weighting tilted towards technology (the Nasdaq 100 ETF, QQQ, and the information technology sector ETF, XLK, have very close to a perfectly positive correlation). Like the S&P 500, is this technology-heavy index being carried by a few large names? We talk about technology leading the markets, but is it all technology stocks, or just a few large names?
To address the question of the Nasdaq’s breadth, I want to point you to the chart below. The chart shows the year-to-date 2021 performance of the Nasdaq 100 (green line), along with the year-to-date performance of the first 50% of its holdings (blue line) and the next 50% (red line) of its holdings. In other words, if you take the Nasdaq 100 index’s holdings and their weights, and then divide the index into two components, how does the largest 50% of the index’s weightings compare to the next 50%?
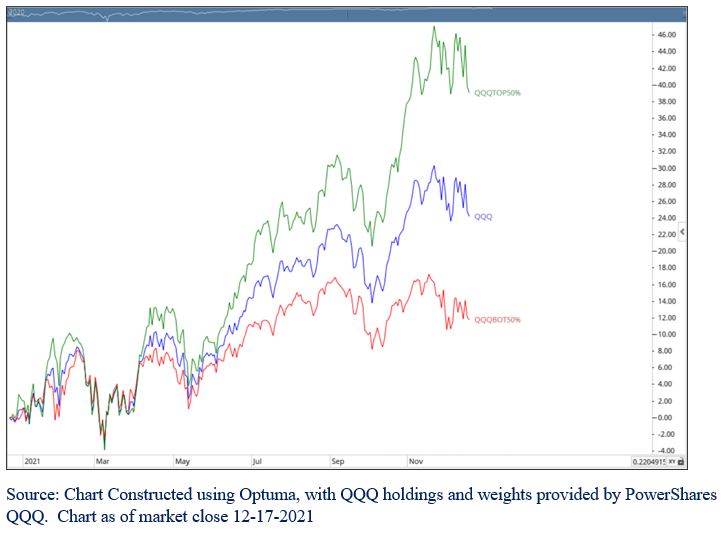
As you can tell from the chart above, the top 50% of the Nasdaq’s holdings (green line) have substantially outperformed the bottom 50% of holdings (red line). There is a clear disparity in strength and breadth. One would expect that if most Nasdaq stocks were performing relatively well, the three colored lines would be much closer together, and therefore the index would have better participation across its holdings.
Here is the big concern:
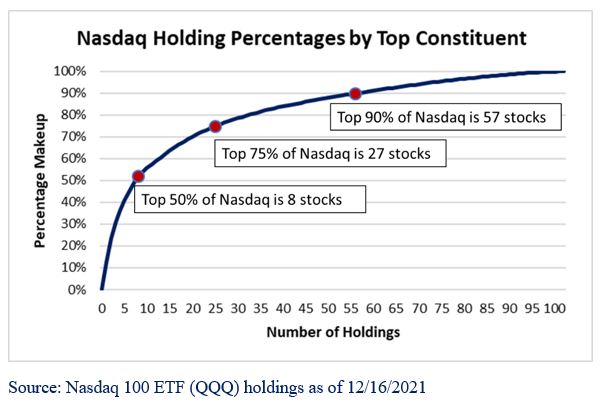
We compared the first 50% of the Nasdaq’s holdings to the next 50%. Each of these two created indexes held the same impact on the Nasdaq 100 index (50% each). But just how many stocks were in each created index? The Nasdaq 100 is made up of 102 stocks, but in order to hold the largest 50% of holdings, you would only need to hold the largest 8 stocks. In other words, the largest 8 Nasdaq 100 stocks have the same impact on the index as the next 94 stocks in the index. In fact, to get to 90% of Nasdaq 100, you would only need a little over half of the components (57 stocks).
This is all to say that most of the performance of the heavy technology index is coming from a select few of mega-cap, overweighted securities.
Largest 50% of the Nasdaq 100 holdings:

Bottom Line
To sum points up: the S&P 500 is heavily weighted towards technology-related stocks, and 50% of the Nasdaq 100 is made up of only 8 stocks. Therefore, the S&P 500 has been led by just a few large tech-related names. In fact, the same 8 largest Nasdaq stocks make up 27% of the S&P 500. In other words, more than a quarter of the market index’s performance is coming from 8 stocks, out of a possible 504 index components.
This is not the first time this has happened. The percent of Tech-related stocks was almost the same in 1999 as it is today. As we discussed at the beginning of this update, tech stocks went up more than 1000 percent from 1993 to 1999. Because the S&P 500 is a momentum index, the hottest performers will grow to be a larger component. Technology-related stocks went from representing 15% of the index in 1993 (when you add in communications stocks) to representing nearly 40% by 1999. The sharp advance seen in tech stocks was ultimately followed by a sharp decline that dragged the rest of the market down with it.
We have all heard the saying of “history repeats itself.” Will history repeat itself in the markets? Markets are driven by supply and demand. Supply and demand are driven by human beliefs and how emotional they are about their future predictions. Throughout the course of history, we have seen significant advances in technology and new business models that would have been unrecognizable in previous generations. That being said, human behavior has remained relatively the same. Whether its tulip bulbs, beanie babies, Pokémon cards, bitcoin, or stocks, markets have a way of sometimes getting too emotional and reacting in a volatile manner. While technology stocks have been the best area of the markets for the last 10-12 years, will the next 10 years be the same? When a bear market comes, and it will eventually, it will have to be led by technology stocks due to its large weight in the markets.
We don’t know when a bear market in technology will occur, only that it will happen at some point, or multiple points in our lifetimes. All parabolic advances lead to the same result eventually—a sharp decline. That is why we practice adaptive portfolio strategy. The goal is not to chase the returns of technology stocks. The goal is to achieve and maintain efficient diversification by holding stocks with low correlation to each other. Efficient diversification is a moving target. It is important to have a method that allows a portfolio’s holdings to adjust and move in concert with the changing market environments. By limiting fluctuations, a portfolio can experience less volatility, more preservation, and compounded growth.
