
Here is a look at Canterbury’s latest risk-adjusted sector rankings, along with their 1-month change in rank. Notice that the energy sector has gone from being ranked the worst sector on a risk-adjusted basis, to being the highest ranked sector. That rise in rank among the S&P 500 sectors probably correlates with the rise in gas prices we have seen in just the last month.
| Sector | Risk Adjusted Rank | 1-Month Change |
| Energy | 1 | +10 |
| Financials | 2 | +3 |
| Discretionary | 3 | +3 |
| Information Technology | 4 | -3 |
| Real Estate | 5 | -3 |
| Consumer Staples | 6 | +2 |
| Communications | 7 | -4 |
| Basic Materials | 8 | +1 |
| Industrials | 9 | +1 |
| Health Care | 10 | -6 |
| Utilities | 11 | -4 |
Source: Canterbury Investment Management
Canterbury’s rankings (as shown above) are risk adjusted. We define risk as volatility— high volatility equates to high risk. Canterbury measures volatility using the “Canterbury Volatility Index” (CVI). CVI is similar to temperature. Generally speaking, a volatility of around 75-90 or less is considered normal or “rational” volatility for an ETF like a US sector fund. What is interesting about energy is that its current volatility level is CVI 146, which is double the average volatility of the other 10 US sectors (whose current average is CVI 74).
So, in other words, in order for the energy sector to be ranked #1 on such high volatility, would mean that it would have to be performing twice as well as the other sectors. Well, in the last 21 trading days (which is about 1-month), the energy sector (ETF: XLE) is up 21%. That’s a parabolic rise.
I am not trying to make a call as to where energy will go from here, whether it is up or down, but be weary of any security that goes too far too fast. The energy sector has been prone to go too far too fast, in both directions, for the last several years, and has often experienced higher volatility and wide range of fluctuations.
The energy sector is at an interesting point. The chart below dates back to 2016 and shows the price movement of energy (ETF: XLE). I have subjectively drawn a line that represents support and resistance. You can see that the energy sector is now at its highest point since February of 2020. This appears to be a point of some significance. Prior to the Coronavirus market event that began in February 2020, energy had hit this support line multiple times, each time bouncing off and putting in a lower high-water mark. Finally, the sector broke through this line of support. Now, the energy sector has been testing this line as a point of resistance, most recently breaking above it. Will this line become support once again? Only a test of the line will tell.
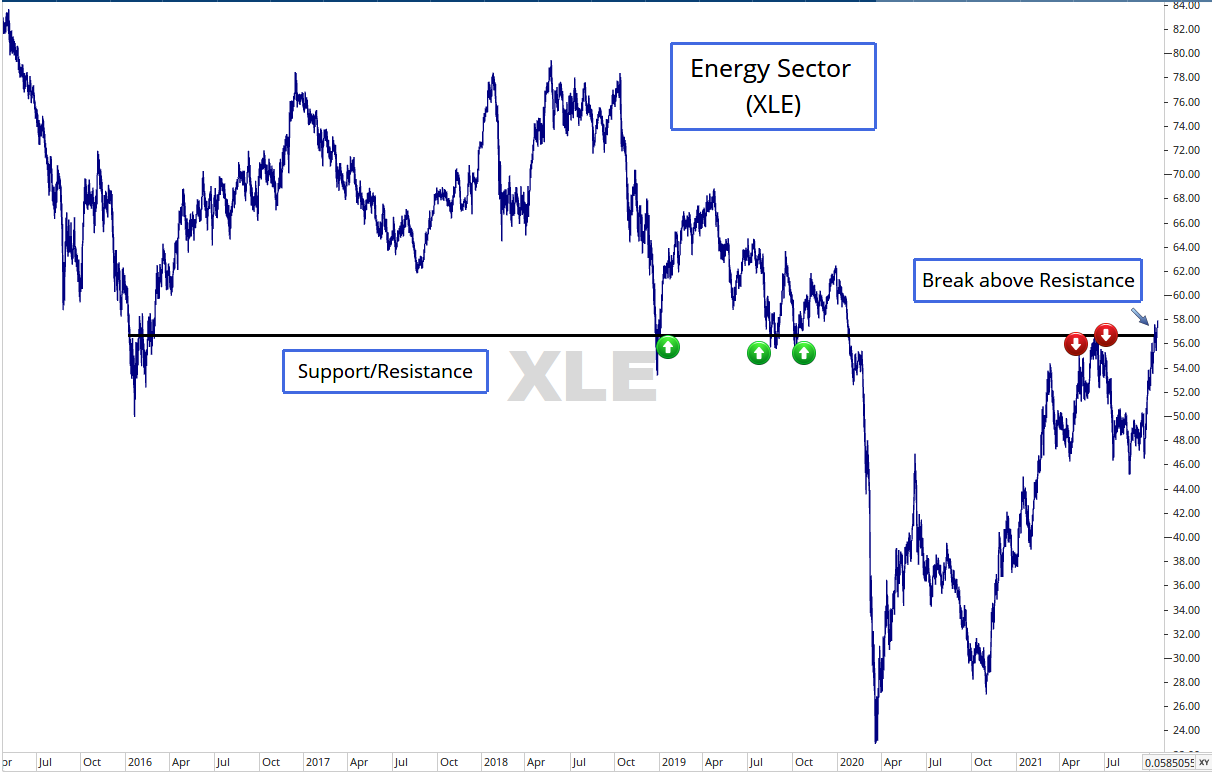
Source: Canterbury Investment Management, Optuma data and charting
I saw an interesting statistic this morning regarding energy stocks. Currently, 53% of S&P 500 stocks are above their 50-day moving average. Looking at the energy sector, 100% of energy stocks (21 stocks) are currently above their 50-day moving average, thanks to the recent rise alluded to earlier.
One fellow Chartered Market Technician, Andrew Thrasher (Twitter: @AndrewThrasher), published on his analytics site that “80% of energy stocks have Relative Strength Index readings above 70. Since 2014, this has happened just two prior times and both instances saw a sharp pullback in the energy sector.” I will add to this that both prior instances were preceded by sharp increases over a short period of time (with trailing 1-month increases of about 12% and 30% respectively).
I have created a chart showing this statistic. For reference, a Relative Strength Index is a momentum-based indicator that measures the magnitude of recent price movements to determine whether a security is “overbought” or “oversold.”
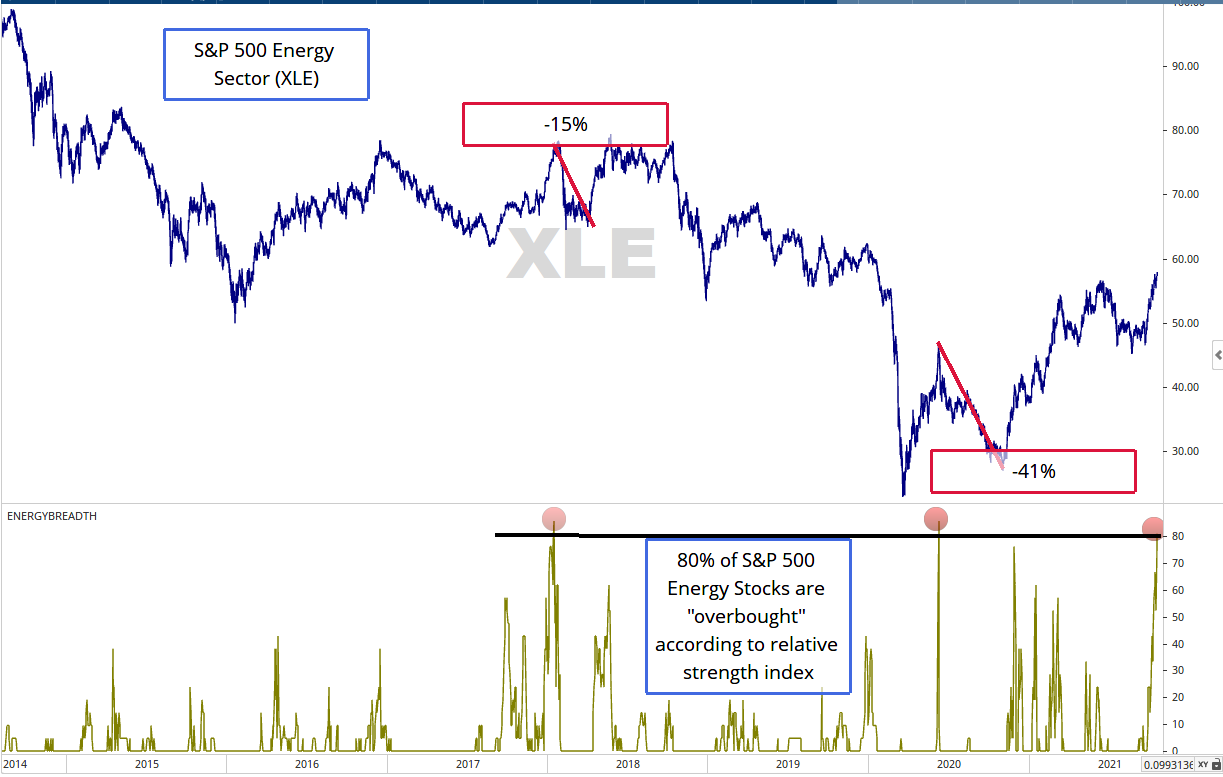
Source: Statistic from Andrew Thrasher & Thrasher Analytics, chart created by Canterbury Investment Management, data and charting software provided by Optuma.
Most energy stocks are currently overbought. Keep in mind that there is no telling how long those securities will remain overbought, nor the impact or extent of a decline in the sector. There is just two samples of this in the last 7 years but is an interesting observation.
Bottom Line
Energy stocks have had a surge in the past month– up more than 20% with no pullbacks or slowdowns. This has placed many energy stocks into overbought territory, and also put the sector at a significant point of potential resistance. Will energy be able to hold the line? Or will high volatility come to bite?
