
Supply chain disruptions have dominated the headlines over the past few quarters and created a bit of headwind to global growth. Shortages in everything from labor to semiconductors have become increasingly acute. These constraints are stunting economic growth and boosting inflationary pressure. Though the economic pain is being felt now, we think these shortages will work themselves out in the coming months. This resolution should result in relatively favorable comparable growth numbers. As a result, we are revising down our real, inflation-adjusted 2021 GDP growth expectation to 6.0%. Additionally, these bottlenecks and inventory drawdowns should push more of the economic recovery into future quarters, so we are revising up our 2022 GDP forecast to 4.5%.
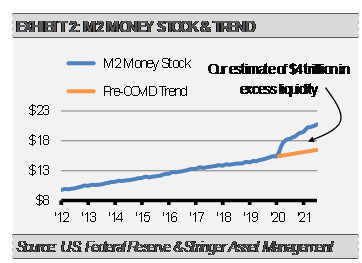
Monetary conditions are a primary input to our forecasts. We estimate that there is close to $4 trillion in excess capital in the U.S. financial system relative to what it would have been based on the pre-COVID trend [exhibit 2]. This pile of excess capital is nearly a fifth of the size of the entire U.S. economy. Most of this excess liquidity will likely be invested and spent in the coming years, which should lead to further economic growth. As the situation evolves and Delta variant numbers subside, we expect jobs creation to reaccelerate and consumer spending and business investment to continue to strengthen as consumers and businesses work through this excess liquidity.
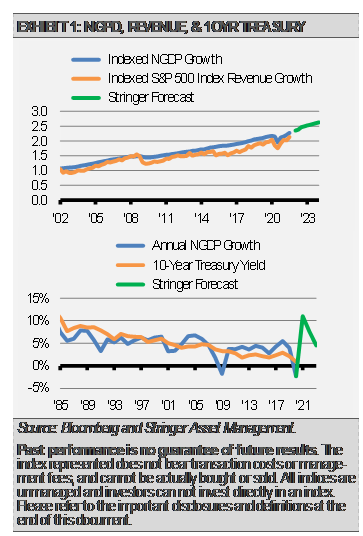
Possibly reflecting expected economic growth and persistent inflation, the yield curve has been rising since the 10-year Treasury yield bottomed in early August. Yield curve steepening tends to portend solid nominal economic growth.
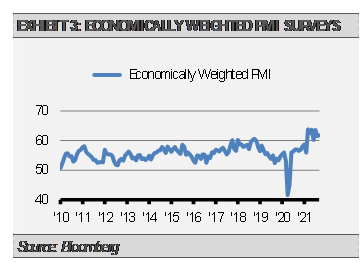
In addition to monetary and yield curve conditions, the Institute for Supply Management’s Purchasing Manager Indexes (PMIs) provide a broader view by aggregating additional leading economic indicators. The economically weighted PMIs for the U.S. held firm at a robust level during September and continue to reflect persistent economic momentum in the months ahead.
We have included these and other factors when updating our forecasts for nominal GDP growth and long-term interest rates. Economic growth leads to corporate revenue growth, higher earnings, and stock market prices. Nominal GDP growth also leads to higher long-term interest rates over time.
INVESTMENT IMPLICATIONS
We expect the markets to be challenged by the shifting pace of global economic growth and higher long-term interest rates. Therefore, we are somewhat defensively positioned currently with an emphasis on defensive sectors and the value style. We currently hold equity sector overweights in health care and financials. Consistent with our forecast for rising long-term interest rates, we are diversified across shorter-duration fixed income including asset-backed securities, bank loans, and multisector income funds.
By putting risk first through our Three Layers of Risk Management process, we believe that we can help investors navigate this shifting economic and market environment. The ability to quickly and actively bias our Strategies either opportunistically or defensively is an important benefit to using our well-defined strategic, tactical, and cash raise processes.
THE CASH INDICATOR
The Cash Indicator (CI) has been useful for helping us judge potential volatility. The CI has risen from exceptionally low levels to the low end of the normal range, reflecting recent economic and market uncertainty. This level suggests the markets functioning normally, so we remain fully invested.
DISCLOSURES
Any forecasts, figures, opinions or investment techniques and strategies explained are Stringer Asset Management, LLC’s as of the date of publication. They are considered to be accurate at the time of writing, but no warranty of accuracy is given and no liability in respect to error or omission is accepted. They are subject to change without reference or notification. The views contained herein are not be taken as an advice or a recommendation to buy or sell any investment and the material should not be relied upon as containing sufficient information to support an investment decision. It should be noted that the value of investments and the income from them may fluctuate in accordance with market conditions and taxation agreements and investors may not get back the full amount invested.
Past performance and yield may not be a reliable guide to future performance. Current performance may be higher or lower than the performance quoted.
Data is provided by various sources and prepared by Stringer Asset Management, LLC and has not been verified or audited by an independent accountant.
Index Definitions:
S&P 500 Index – This Index is a capitalization-weighted index of 500 stocks. The Index is designed to measure performance of a broad domestic economy through changes in the aggregate market value of 500 stocks representing all major industries.
