
At this stage in the economic recovery, those investors that stuck with their financial plan are likely feeling relatively content whereas those that are holding more cash than needed may be feeling nervous about entering the markets at their current levels. We are continuously being asked: where do we go from here with equity markets at all-time highs and interest rates low?
As we determine our location in the business cycle through the lens of our Three Layers of Risk Management: Strategic, Tactical, and the Cash Indicator, we see that the economy has passed from the initial stage of the recovery onto the second stage with the pace of economic growth moderating. However, we are likely far from anything that might resemble an economic crisis.
The flood of liquidity and cash coming into the financial system from government support coupled with an improved economy and an improving jobs market means that any equity market selloff should be short-lived and relatively shallow in our opinion.
When considering the timing of investing excess cash, we think investors should look past trying to time the market. As our process and history have shown, there are rare occasions where holding excess cash is warranted but those periods are few and far between. The decidedly upward bias to markets suggests the better course of action is to commit to the markets and base any excess cash allocation decisions outside of liquidity needs on a well-defined process like our Cash Indicator methodology.
To be clear, we do believe that dollar cost averaging makes sense, especially over very long periods of time and with regular intervals, such as the process for many retirement plans.
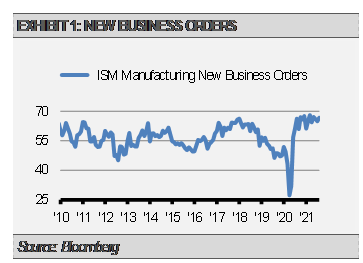
While the monthly jobs report for August showed disappointing jobs gains, it’s important to note that this economic measure is a lagging indicator and provides little information about what we should expect going forward. Instead, we focus on leading indicators, such as monetary conditions (e.g., year-over-year M2 Growth), credit conditions, jobless claims and unfilled job openings, as well as the ISM Manufacturing New Orders Index.
For example, the ISM Manufacturing New Orders Index registered a very strong 66.70 in August, which is at the high end of the current economic recovery range (exhibit 1). This suggests that business pipelines are full, and the economy should continue to grow for months to come.
Monetary conditions are also supportive although the pace of liquidity growth is slowing (exhibit 2). This makes sense given the massive size of the U.S. Federal Reserve’s (the Fed) liquidity operations during the initial phase of the crisis. We expect the pace of liquidity growth to decline further as the Fed begins to reduce, or taper, its asset purchases in the coming months. We think that slower liquidity growth is one of the factors that will lead to softening, yet still solid, economic growth in the coming 12-18 months.

Finally, we expect a reacceleration in jobs creation in the coming months. According to the National Federation of Independent Businesses (NFIB), a record 50% of small businesses had job openings they could not fill in August (exhibit 3). Businesses also reported increasing wages to attract qualified workers.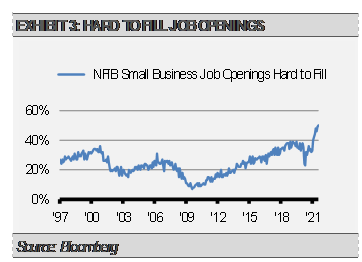
We think that the combination of higher potential wages, enhanced unemployment claims going away, schools reopening, and our society generally learning to live with COVID-19 will result in faster jobs gains in the months to come.
With continued, yet slower, economic growth ahead, we think that the economy is moving through the second phase of the business cycle. As a result, we have been reducing our cyclical exposures and increasing our allocations to growth and momentum. Still, our Strategies remain rather defensively positioned as we see stretched equity market valuations and complacency creating vulnerabilities.
By putting risk first through our Three Layers of Risk Management process, we believe that we can help investors navigate this shifting economic and market environment. The ability to quickly and actively bias our Strategies either opportunistically or defensively is an important benefit to using our well-defined strategic, tactical, and cash raise processes.
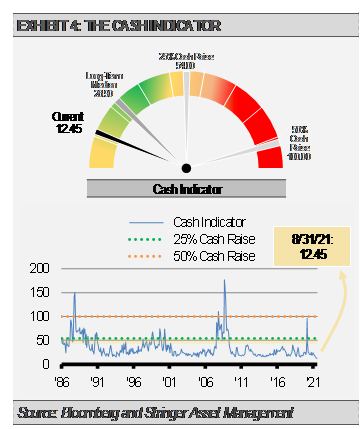
THE CASH INDICATOR
The Cash Indicator (CI) has been useful for helping us judge potential volatility. Currently, the CI is near the low end of its normal range. Markets have been complacent for months with both little equity market volatility and tight bond market credit spreads. The massive amount of liquidity in the system may be keeping markets abnormally quiet. However, complacent markets are vulnerable to shocks. We would take any significant shocks as a buying opportunity for long-term investors.
DISCLOSURES
Any forecasts, figures, opinions or investment techniques and strategies explained are Stringer Asset Management, LLC’s as of the date of publication. They are considered to be accurate at the time of writing, but no warranty of accuracy is given and no liability in respect to error or omission is accepted. They are subject to change without reference or notification. The views contained herein are not be taken as an advice or a recommendation to buy or sell any investment and the material should not be relied upon as containing sufficient information to support an investment decision. It should be noted that the value of investments and the income from them may fluctuate in accordance with market conditions and taxation agreements and investors may not get back the full amount invested.
Past performance and yield may not be a reliable guide to future performance. Current performance may be higher or lower than the performance quoted.
Data is provided by various sources and prepared by Stringer Asset Management, LLC and has not been verified or audited by an independent accountant.
