
I hope that everyone had a happy Labor Day weekend.
This brief market update will touch on 3 different key areas:
- The current state of the markets
- Market Leadership
- Under the hood of the markets
Current State of the Markets
Low or decreasing volatility is a bullish, positive indicator. Bull markets typically increase on low volatility. Bear markets have erratic behavior on high volatility. Today, the Canterbury Volatility Index (CVI) reads CVI 48 on the S&P 500, which measures the largest capitalized US stocks. For reference, when looking at a broad index like the S&P 500, a CVI level below 75 is generally considered low volatility.
A volatility reading of CVI 48 indicates that volatility is at an extremely low level. When volatility gets down to the current levels, it is a sign that the market is being compressed. This is like the squeezing of a spring. The more you squeeze down the spring, or compress the market’s volatility, the more pressure that gets built up. As the pressure builds, the market is likely to relieve some of this pressure in the form of an “outlier day,” which is a trading day that can be up, but usually down, 1.50%.
A volatility reading of CVI 48 is the lowest that we have seen so far in 2021, and the lowest it has been since January of 2020. Back in January of 2020, volatility got as low as CVI 43, before experiencing back-to-back days of -1% and -1.50% (on the S&P 500). In other words, be on the lookout for an outlier day, but don’t panic when one occurs. More often than not, it is just a way the market relieves some built up pressure. Bear markets require time to form and have several negative characteristics that we have not seen yet.
Market Leadership
If we look across our equity universe of exchange-traded-funds (ETFs) which measure anything from indexes; sectors; industries; countries; and geographic regions, all but three ETFs (out of 123) currently have a buy/hold signal. The three areas that currently show a sell are Brazil, aerospace/defense, and pharmaceuticals. In other words, many areas are showing a buy/hold signal.
That being said, there has been one clear market leader: Technology. The Nasdaq has continued its strong performance. It’s the only sector to show significant benefit from the pandemic’s market events. For the first quarter of 2021 it was looking like value would play a game of catchup. Since that point, technology has taken off, leaving several other market segments in the dust.
Under the Hood of the Markets
Technology’s impact on the market
The S&P 500 is a capitalization weighted index. It is composed of 11 Macro Economic Sectors. There are times when the Sectors are equally balanced which means that the “market index” looks like a typical investors’ equity portfolio. Other times, one or two sectors will substantially outperform the others. When this occurs, the S&P 500 no longer resembles a normal portfolio and is no longer an appropriate benchmark for comparison purposes.
Back in 1992, the S&P 500 Sectors were fairly well balanced. Communications and Technology made up 13.6%. In 1999 the Communications and Technology Sectors had substantially outperformed over the previous 7 years and made up 41.2% of the index. The bubble in the two Sectors led to the “Tech Wreck” from 2000 to 2002. The only other time that one Sector made up such a large percentage of the S&P 500 was the bubble in Financials (about 25%) which was followed by the Financial Crisis in 2008.
Today, the Communications and Technology Sectors have formed a bubble similar to 1999 and 2000. In 1999 the two sectors accounted for 38.1% of the S&P 500 (Now over 40%). This over-weight in Tech related stocks has distorted the returns of the S&P 500 over the last 8 years, just like it did during the 8 years from 1992 to 2000. The outperformance was quickly negated by the “tech wreck.” Today, we do have a bubble in Technology, and that bubble will eventually burst.
Advance-Decline Line
Take a look at the stocks-only Advance-Decline line. The Advance-Decline shown is representative of the largest 1500 US stocks. While the S&P 500 has put in new highs for the last few months, the A/D Line has gone flat. This a clear divergence. You want to see a rising tide lifting all ships. Instead, you are seeing large tech stocks (which make up north of 40% of the S&P 500) carry the index higher. Other sectors have been flat, or in some cases, down.
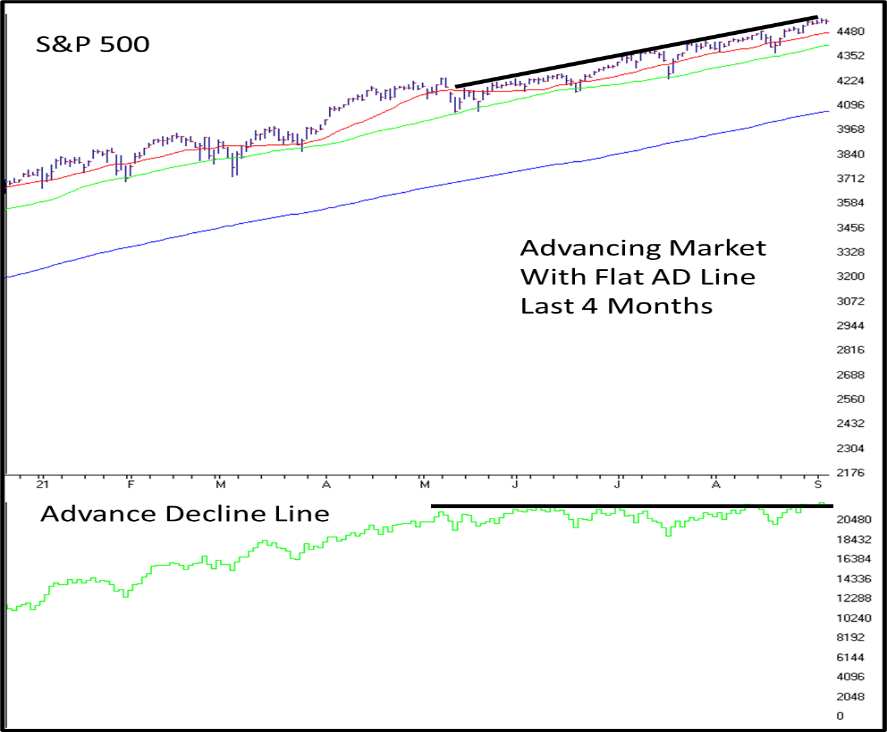
Source: AIQ Trading Expert Pro
Small Cap Securities
Small cap securities have gone flat over the course of the last several months. While we have seen advances in large cap securities, small caps are in a trading range. Keep in mind that the S&P 500 represents just 500 stocks and is realistically carried by less than half of those (the largest 250 stocks make up 88% of the index’s movement). Small cap stocks are represented by the Russell 2000. The Russell 2000 is composed of the smallest 2000 components of the Russell 3000, which is supposed to represent the broad US market.
The Russell 2000 has moved sideways. Again, while large caps advance, carried by technology-related securities, many other market segments have gone flat for the past few months, as shown below.
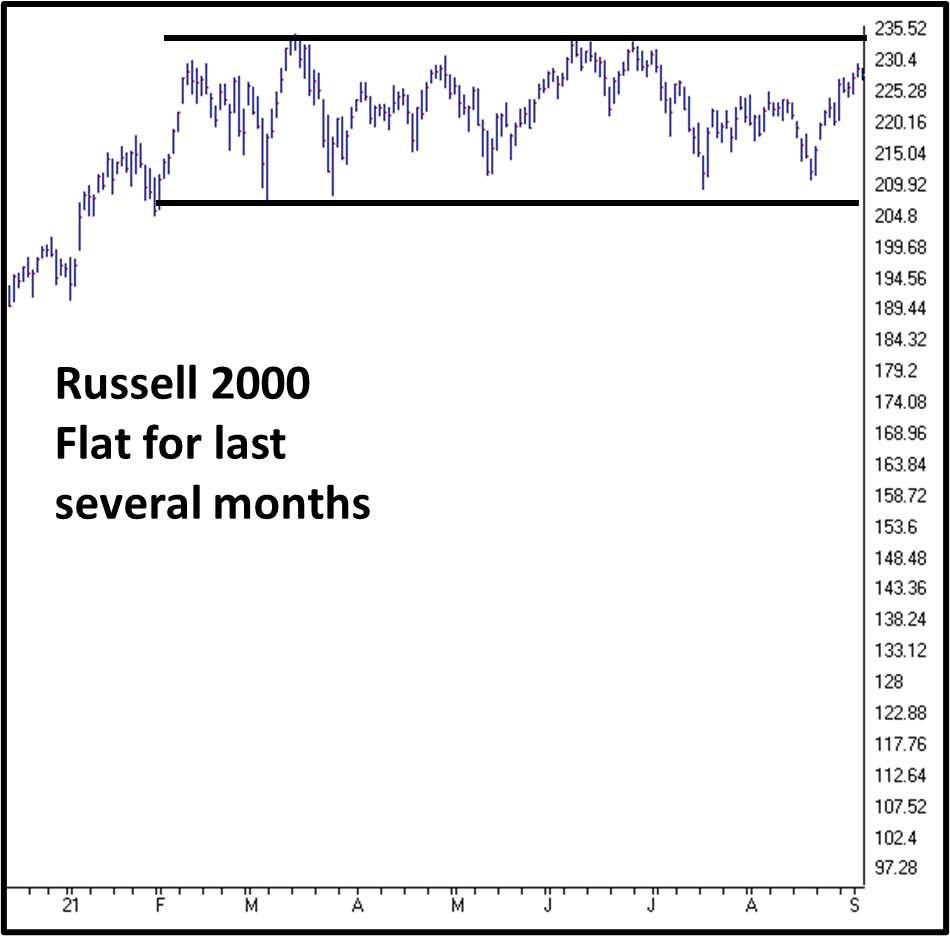
Source: AIQ Trading Expert Pro
Bottom Line
To summarize the points in this update:
- The broad markets are bullish, with low volatility
- However, the market’s rise has been fueled by a small number of technology-related, large cap securities, as shown by a flat A/D Line
- Small cap stocks have moved sideways for the last several months
Right now, volatility on the S&P 500 is low. That is a positive sign for the market, but market participation has been less than ideal. A rising tide is not lifting all ships and is being fueled by a small number of securities. While many areas of the markets have positive characteristics, large cap technology has dominated.
Technology-related stocks have outperformed every other market segment for the last 10 years. In fact, its impact on the market has doubled in the last 10 years. In the past, when the markets have become “out of balance” due to a sector making up a significant portion, that sector has often been the cause of a bear market that follows. Now, that bear market has not begun to unfold yet, but when it does occur, technology will probably be a significant culprit.
