
By Matt Wagner, CFA, Associate, Research
One of the first lessons taught in Intro to Finance is the Capital Asset Pricing Model (CAPM):
ERi = Rf + βi (ERm − Rf)
This model offers an expected return for asset i (ERi) as a function of the risk-free interest rate (Rf) plus the systematic risk (beta) of asset i (βi) multiplied by the market risk premium (ERm − Rf).
In short: high beta (riskier) stocks should be expected to have higher returns than low beta (less risky) stocks.
Reality plays out differently.
The highest beta stocks—the 20% of stocks with the highest beta—have lagged the market, and the lowest beta stocks—lowest 20%—by 60 basis points (bps) and 63 bps, respectively, since 1963.
Quintile Portfolios Sorted by Beta
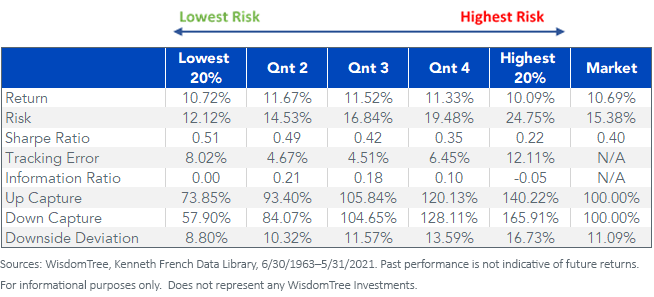
For definitions of terms in the chart, please visit the glossary.
Countless papers have been written with the aim of improving this model. But one of the central reasons it is still taught in Finance 101, aside from its ease in calculating, is the importance of its main assumption: in a world of efficient markets, riskier stocks should outperform less risky stocks.
This worldview was the launching point for factors like size (SMB) and value (HML) that were added as complements to market beta in the seminal three-factor model paper by Eugene Fama and Kenneth French1.
ERi = Rf + β1 (ERm − Rf) + β2 (SMB) + β3 (HML) + α + ε
Fama-French argued that riskier stocks do indeed outperform less risky stocks, but that market beta is not an all-encompassing variable for riskiness.
Value stocks and smaller-cap stocks represent risk premiums that improved the statistical significance of the CAPM model in explaining returns.
The Quality Factor: What Is it and Why Does it Exist?
An additional academic factor that has gained significant following in the investment community is quality. Unlike market beta, size and value, it does not have a straightforward risk-based story.
High-quality companies—companies with high earnings, low debt, low variability in earnings—should be highly valued relative to low-quality companies, resulting in lower expected returns.
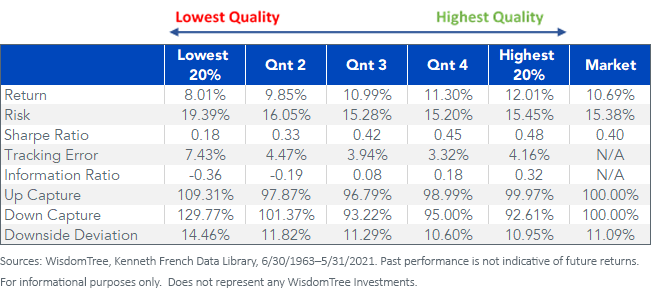
From a risk perspective, quality companies have had lower down capture than the market and lower downside deviation. These are characteristics that loss-averse investors should prefer, and thus efficient markets would compensate with below-market returns.
The anomaly of higher-quality stocks, measured here by operating profitability, outperforming lower-quality stocks by 400 bps annualized looks like a case of “a free lunch.”
Quintile Portfolios Sorted by Operating Profitability
One theory explaining the anomaly is that these stocks may be riskier, but the risk is more difficult to observe using measures like standard deviation.
For example, perhaps more of their value comes from distant earnings, making them more sensitive to fluctuations in interest rates and/or exposed to meeting lofty earnings growth expectations.
An alternative, more commonly accepted, theory is that investors have an array of behavioral biases that cause them to be under-weight in quality stocks2. For example:
- Conservativism bias suggests investors are slow to update their opinions/forecasts based on new information, like strong or weak earnings
- Overconfidence bias could lead investors to over-weight their forecast of future earnings prospects over current profits
- Confirmation bias leads people to ignore new information that contradicts previous beliefs
Defining Quality
The quality factor is subject to greater differentiation in definition than factors like beta, value and size.
At WisdomTree, our dividend- and earnings-weighted indexes were constructed with value-focused tilts to higher dividend yields and lower P/E ratios, respectively. As a by-product of their cash-flow based methodologies, both have had statistically significant exposure to quality (red numbers in the table below indicate statistically insignificant factor loadings).
This contrasts with the negative exposure to quality often found in value indexes that focus on price-to-book, like the Russell Value indexes.
Fama-French Factor Loadings (Chart 1 of 2)
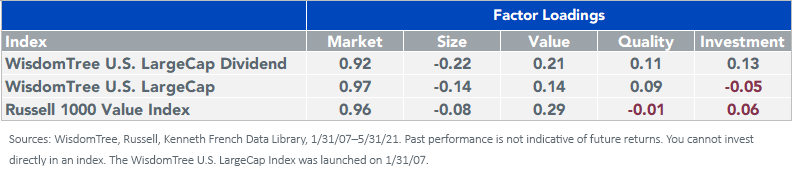
For definitions of indexes in the chart, please visit our glossary.
Fama-French Factor Loadings (Chart 2 of 2)
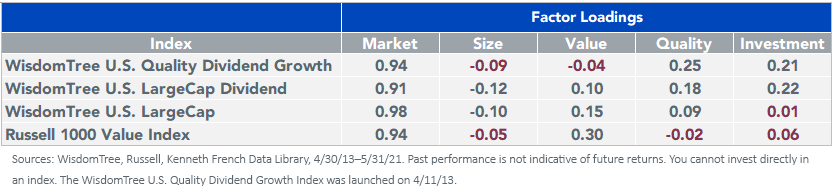
For definitions of indexes in the chart, please visit our glossary.
Conclusion
In a market environment where certain “meme stocks” are clearly trading without regard to fundamentals like earnings, perhaps we are seeing a real-time example of how behavioral biases can cause some investors to be under-exposed to quality in their portfolios.
Originally published by WisdomTree, 7/8/21
1 Fama, Eugene F., and Kenneth R. French. “The Cross-Section of Expected Stock Returns.” The Journal of Finance, vol. 47, no. 2, 1992, pp. 427–465.
2 Thesmar, David & Bouchaud, Jean-Philippe & Stefano, Ciliberti & Landier, Augustin & Simon, Guillaume, 2016. “The Excess Returns of ‘Quality’ Stocks: A Behavioral Anomaly,” HEC Research Papers Series 1134, HEC Paris.
U.S. investors only: Click here to obtain a WisdomTree ETF prospectus which contains investment objectives, risks, charges, expenses, and other information; read and consider carefully before investing.
There are risks involved with investing, including possible loss of principal. Foreign investing involves currency, political and economic risk. Funds focusing on a single country, sector and/or funds that emphasize investments in smaller companies may experience greater price volatility. Investments in emerging markets, currency, fixed income and alternative investments include additional risks. Please see prospectus for discussion of risks.
Past performance is not indicative of future results. This material contains the opinions of the author, which are subject to change, and should not to be considered or interpreted as a recommendation to participate in any particular trading strategy, or deemed to be an offer or sale of any investment product and it should not be relied on as such. There is no guarantee that any strategies discussed will work under all market conditions. This material represents an assessment of the market environment at a specific time and is not intended to be a forecast of future events or a guarantee of future results. This material should not be relied upon as research or investment advice regarding any security in particular. The user of this information assumes the entire risk of any use made of the information provided herein. Neither WisdomTree nor its affiliates, nor Foreside Fund Services, LLC, or its affiliates provide tax or legal advice. Investors seeking tax or legal advice should consult their tax or legal advisor. Unless expressly stated otherwise the opinions, interpretations or findings expressed herein do not necessarily represent the views of WisdomTree or any of its affiliates.
The MSCI information may only be used for your internal use, may not be reproduced or re-disseminated in any form and may not be used as a basis for or component of any financial instruments or products or indexes. None of the MSCI information is intended to constitute investment advice or a recommendation to make (or refrain from making) any kind of investment decision and may not be relied on as such. Historical data and analysis should not be taken as an indication or guarantee of any future performance analysis, forecast or prediction. The MSCI information is provided on an “as is” basis and the user of this information assumes the entire risk of any use made of this information. MSCI, each of its affiliates and each entity involved in compiling, computing or creating any MSCI information (collectively, the “MSCI Parties”) expressly disclaims all warranties. With respect to this information, in no event shall any MSCI Party have any liability for any direct, indirect, special, incidental, punitive, consequential (including loss profits) or any other damages (www.msci.com)
Jonathan Steinberg, Jeremy Schwartz, Rick Harper, Christopher Gannatti, Bradley Krom, Tripp Zimmerman, Michael Barrer, Anita Rausch, Kevin Flanagan, Brendan Loftus, Joseph Tenaglia, Jeff Weniger, Matt Wagner, Alejandro Saltiel, Ryan Krystopowicz, Kara Marciscano, Jianing Wu and Brian Manby are registered representatives of Foreside Fund Services, LLC.
WisdomTree Funds are distributed by Foreside Fund Services, LLC, in the U.S. only.
You cannot invest directly in an index.
