
By Rebecca Felton
Cyclical Sectors Responded Well to Vaccines, Stimulus, and Pent-up Demand
A little over twelve months ago, investors were looking for signs that the bull market and multi-year economic expansion were coming to an end. The onset of COVID-19 put an end to both, but now investors are focused on a new expansion and a new bull market with different dynamics. As we have navigated back and forth between optimism and pessimism, we have also seen leadership changes across asset classes and investment styles. The combination of massive amounts of global stimulus, accommodative central banks, and widespread distribution of the vaccine has helped fuel broader participation beyond just US large cap and growth sectors.
The table below illustrates that point as US small and mid-cap equities were the best performing asset class over the quarter as well as the trailing twelve months rising nearly 15% and 87%, respectively. With the recovery theme gaining traction, emerging markets equities have also rebounded strongly over the past year with a 58% increase. The stalwart S&P 500 continued its 12-month climb off last year’s March lows with a 6% gain during the quarter which brought the trailing twelve months gain to 56%. Perhaps there was no better illustration of investors’ general risk-on psychology than the negative performance in investment grade and treasury bonds which both saw losses in the quarter. Gold also fell 9%.
The table below shows the performance of asset classes on the left and US equity sectors on the right. Returns for both the 1st quarter and the trailing 12 months (TTM) are shown. The table is anchored by US Large-Cap equities (S&P 500 Index), which are shaded, and allows for easier comparison to see higher and lower relative performance by each asset classes and sector.
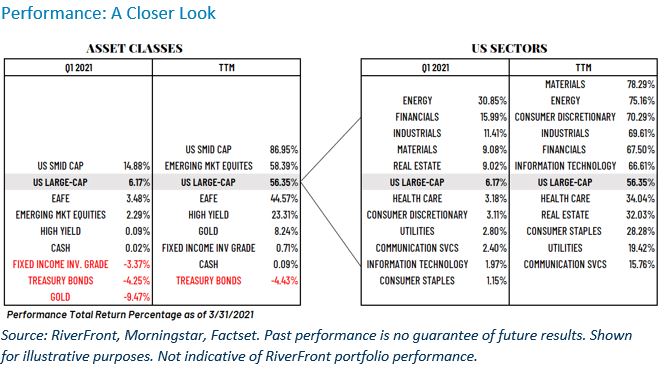
The rising tide did lift all boats as all eleven equity sectors had positive performance during the quarter and the past twelve months:
Cyclical sectors such as energy, financials, and industrials took the lead in the quarter as each sector saw double-digit year-over-year gains. Not surprisingly, the energy and financial sectors had the largest increases in earnings estimate revisions as Wall Street continues to raise expectations for the economic recovery. Higher expectations for the energy sector were boosted by a 22% increase in the price of oil as well as prospects for the reopened economy. Financial sector earnings also moved higher with prospects for higher loan growth and higher net interest margins.
We believe diversification and selection will be the keys to success this year:
The shift in leadership from growth to value during the quarter was also evidenced by the performance of the information technology sector. It rose only 2% during the three-month period after being the strongest performer during 2020. Ironically, a review of the sectors that outperformed the S&P 500 Index (US Large Cap in the table above) over the entire trailing twelve months confirms that a mix of both growth and value served investors well. Materials, energy, consumer discretionary, industrials, financials and information technology outperformed the index over the period. This group represents a mix of sectors that benefit from a ‘stay-at-home’ world as well as one that is in recovery mode. Our current domestic equity selection is characterized by what we refer to as a ‘barbell’ approach in order that we have diversification for both conditions. On one side of the barbell, we have increased our exposure to sectors that should benefit from the recovery and from new policies emanating from the Biden administration. These include materials, energy, industrials, cyclical consumer discretionary, and financials. On the other side of the barbell, we believe our exposures in quality branded consumer companies and technology companies offer resilience in a variety of economic conditions.
We have increased our exposure to international equities in 2021, but we believe economies outside of the US are recovering more slowly. We are encouraged by improving economic indicators in Europe and Asia but will likely wait to see confirmation of sustained improvement before increasing allocations there.
Process over Prediction:
We see a strong global synchronized economic recovery unfolding and are thus constructive on stocks in 2021. However, our near-term outlook is more cautious given the current reading from our tactical signals. RiverFront‘s Tactical Process guides our investment decisions over shorter, three-month time horizons. As we noted in our March 1, 2021, Weekly View “The Three Rules Play Red Light, Green Light” our tactical rules are flashing caution for two reasons. We are concerned that the 200-day moving average while continuing to rise, is doing so at what we believe is an unsustainable rate. Additionally, the crowd sentiment indicators are in extreme optimism. We believe these conditions suggest a higher probability of a short-term correction, but we believe any such correction would be temporary.
Important Disclosure Information
The comments above refer generally to financial markets and not RiverFront portfolios or any related performance. Opinions expressed are current as of the date shown and are subject to change. Past performance is not indicative of future results and diversification does not ensure a profit or protect against loss. All investments carry some level of risk, including loss of principal. An investment cannot be made directly in an index.
Chartered Financial Analyst is a professional designation given by the CFA Institute (formerly AIMR) that measures the competence and integrity of financial analysts. Candidates are required to pass three levels of exams covering areas such as accounting, economics, ethics, money management and security analysis. Four years of investment/financial career experience are required before one can become a CFA charterholder. Enrollees in the program must hold a bachelor’s degree.
Information or data shown or used in this material was received from sources believed to be reliable, but accuracy is not guaranteed.
This report does not provide recipients with information or advice that is sufficient on which to base an investment decision. This report does not take into account the specific investment objectives, financial situation or need of any particular client and may not be suitable for all types of investors. Recipients should consider the contents of this report as a single factor in making an investment decision. Additional fundamental and other analyses would be required to make an investment decision about any individual security identified in this report.
The Advantage portfolios may be invested in stocks, bonds and exchange-traded products (exchange-traded funds (ETFs) and exchange-traded notes (ETNs)). Advantage is offered through separately managed accounts or on model delivery platforms, depending on the Sponsor Firm.
In a rising interest rate environment, the value of fixed-income securities generally declines.
High-yield securities (including junk bonds) are subject to greater risk of loss of principal and interest, including default risk, than higher-rated securities.
Small-, mid- and micro-cap companies may be hindered as a result of limited resources or less diverse products or services and have therefore historically been more volatile than the stocks of larger, more established companies.
Technology and Internet-related stocks, especially of smaller, less-seasoned companies, tend to be more volatile than the overall market.
When referring to being “overweight” or “underweight” relative to a market or asset class, RiverFront is referring to our current portfolios’ weightings compared to the composite benchmarks for each portfolio. Asset class weighting discussion refers to our Advantage portfolios. For more information on our other portfolios, please visit www.riverfrontig.com or contact your Financial Advisor.
Investing in foreign companies poses additional risks since political and economic events unique to a country or region may affect those markets and their issuers. In addition to such general international risks, the portfolio may also be exposed to currency fluctuation risks and emerging markets risks as described further below.
Changes in the value of foreign currencies compared to the U.S. dollar may affect (positively or negatively) the value of the portfolio’s investments. Such currency movements may occur separately from, and/or in response to, events that do not otherwise affect the value of the security in the issuer’s home country. Also, the value of the portfolio may be influenced by currency exchange control regulations. The currencies of emerging market countries may experience significant declines against the U.S. dollar, and devaluation may occur subsequent to investments in these currencies by the portfolio.
Foreign investments, especially investments in emerging markets, can be riskier and more volatile than investments in the U.S. and are considered speculative and subject to heightened risks in addition to the general risks of investing in non-U.S. securities. Also, inflation and rapid fluctuations in inflation rates have had, and may continue to have, negative effects on the economies and securities markets of certain emerging market countries.
Stocks represent partial ownership of a corporation. If the corporation does well, its value increases, and investors share in the appreciation. However, if it goes bankrupt, or performs poorly, investors can lose their entire initial investment (i.e., the stock price can go to zero). Bonds represent a loan made by an investor to a corporation or government. As such, the investor gets a guaranteed interest rate for a specific period of time and expects to get their original investment back at the end of that time period, along with the interest earned. Investment risk is repayment of the principal (amount invested). In the event of a bankruptcy or other corporate disruption, bonds are senior to stocks. Investors should be aware of these differences prior to investing.
Sectors based on Global Industry Classification Standard (GICS) a standardized classification system for equities developed jointly by Morgan Stanley Capital International (MSCI) and
Standard & Poor’s. The GICS hierarchy begins with 11 sectors and is followed by 24 industry groups, 67 industries, and 147 sub-industries.
Standard & Poor’s (S&P) 500 Index TR USD (US Large Cap) measures the performance of 500 large cap stocks, which together represent about 80% of the total US equities market.
Asset Class Definitions:
S&P 1000 Index TR USD (US SMID Cap) is a combination of the S&P Mid Cap 400 Index TR USD & S&P Small Cap 600 Index TR USD.
MSCI EAFE Index TR USD (Developed International Equities) is an equity index that captures large and mid cap representation across developed market countries around the world, excluding the US and Canada.
MSCI Emerging Markets Index NR USD (Emerging Market Equities) is an equity index that captures large and mid cap representation across 23 emerging markets (EM) countries.
Bloomberg Barclays Capital US Treasury Index TR USD (Treasury Bonds) measures the performance of the US Treasury bond market.
Bloomberg Barclays US Aggregate Bond Index TR USD (Fixed Income Investment Grade) is an unmanaged index that covers the investment grade fixed rate bond market with index components for government and corporate securities, mortgage pass-through securities, and asset-backed securities. The issues must be rated investment grade, be publicly traded, and meet certain maturity and issue size requirements.
ICE BofA Merrill Lynch High Yield Index TR USD (High Yield) which tracks the performance of US dollar denominated below investment grade rated corporate debt publicly issued in the US domestic market. Index constituents are capitalization-weighted based on their current amount outstanding times the market price plus accrued interest.
Bloomberg Barclays Capital 1–3 Month US Treasury Bill Index TR USD (Cash) includes all publicly issued zero-coupon US Treasury Bills with a remaining maturity between 1 and 3 months, are rated investment-grade, and have an outstanding face value of $250 million or more.
LBMA Gold Price PM ($/OZt) (GOLD) – the London gold price per troy ounce of gold for delivery in London through a member of the LBMA authorized to effect such delivery, stated in U.S. Dollars, as calculated and administered by independent service provider (S) and published by the LBMA on its website at www.lbma.org.uk
RiverFront Investment Group, LLC (“RiverFront”), is a registered investment adviser with the Securities and Exchange Commission. Registration as an investment adviser does not imply any level of skill or expertise. Any discussion of specific securities is provided for informational purposes only and should not be deemed as investment advice or a recommendation to buy or sell any individual security mentioned. RiverFront is affiliated with Robert W. Baird & Co. Incorporated (“Baird”), member FINRA/SIPC, from its minority ownership interest in RiverFront. RiverFront is owned primarily by its employees through RiverFront Investment Holding Group, LLC, the holding company for RiverFront. Baird Financial Corporation (BFC) is a minority owner of RiverFront Investment Holding Group, LLC and therefore an indirect owner of RiverFront. BFC is the parent company of Robert W. Baird & Co. Incorporated, a registered broker/dealer and investment adviser.
To review other risks and more information about RiverFront, please visit the website at www.riverfrontig.com and the Form ADV, Part 2A. Copyright ©2021 RiverFront Investment Group. All Rights Reserved. ID 1590717
