
By Rebecca Felton
Earnings Visibility Improving
Last year during first quarter 2020 earnings season – the first period impacted by the novel coronavirus – we advised investors to pay attention to the words and tone used by management teams discussing current business conditions. Words mattered more than the numbers as Wall Street analysts were forced to reduce forecasts significantly for 2020. Now, we know the lowered estimates were too conservative. As the recovery unfolds, it appears the S&P 500 is on the verge of returning to positive growth for the first time since the end of 2019. We now believe the words and the numbers matter.
This week’s focus on earnings is about more than just earnings season. Concerns over market valuation are growing louder. Corporate earnings garner attention as one of several financial components of a company’s performance. Ratio-based analysis, a common approach used to assign values to companies, helps us determine relative valuation. The S&P 500 is currently valued at a P/E multiple of 22.2x forward 12-month earnings. This is above the five- year average of 17.7x according to FactSet and is one of the reasons some investors are worried. An absolute number, such as 19x for example, carries little meaning by itself because there is no context. It becomes more useful when measured against the company’s historical price-to-earnings (P/E) range, that of the competition, and the ratio for the market as a whole. We believe other important factors include the economic backdrop and interest rate environment. We need to be aware of above average valuations, but the fact that equity markets are considered ‘expensive’ is not reason enough to cause markets to trade lower.
We believe there are several factors that could support above average valuations.
Earnings revisions are trending higher:

Past performance is no guarantee of future results. Shown for illustrative purposes. Not indicative of RiverFront portfolio performance. Index definitions are available in the disclosures
The circle in the chart right illustrates the strength in global ‘earnings momentum’ – a ratio of how many analysts’ estimates for quarterly earnings are being revised higher versus lower. A reading above zero suggests positive net revisions – a sign analysts were too pessimistic. For the US, S&P operating earnings were forecast for 2021 to be $164.40 at the beginning of the year and now are $170.55. If achieved this would be an all-time high for S&P 500 operating earnings per share. Given all the economic disruption from COVID-19, this would be remarkable and one of the reasons why the S&P 500 has done so well over the past twelve months.
While not all regions of the world will show positive year over year growth, earnings in Europe and Japan are also surprising positively. Earnings surprises generally lead to revisions. There remains a large gap between the highest and lowest consensus forecasts for forward estimates for the S&P 500. In our opinion, that disparity underscores the element of unknown that remains as we look ahead through the remainder of 2021 and try to gauge a fully reopened US.
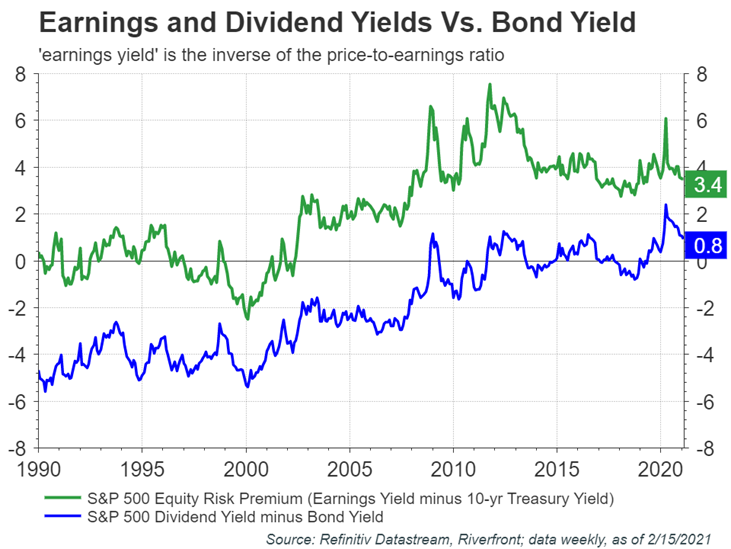
Interest rates will likely stay low for a while:
Past performance is no guarantee of future results. Shown for illustrative purposes. Not indicative of RiverFront portfolio performance. Index definitions are available in the disclosures.
We believe equities remain the most attractive asset class for long term investors as interest rates will likely stay low for the foreseeable future. In the January 19th Strategic View (The 21st Century Retirement Plan: Sustain Phase), we discussed the relative attractiveness of dividend yields when compared to 10-year Treasury bond yields. This relationship is shown in the chart right. During his most recent comments, Federal Reserve Chairman Jerome Powell signaled continued policy support noting the need for ‘patiently accommodative monetary policy’ as the US employment picture continues to struggle. The US unemployment rate has fallen from the 2020 high of 14.8% to 6.3%, but it is still above the Fed’s target of between 4% and 5%.
The inflation outlook remains reasonable:
At this writing, leaders in Washington D.C. are working to pass President Joe Biden’s proposed $1.9 trillion coronavirus relief bill, adding to the already record fiscal and monetary stimulus that we have seen thus far into the pandemic crisis. This has sparked fears of a return to inflation, but we believe inflationary pressures are tame for now. The most recently released core Consumer Price Index (CPI) rose 1.4% for the twelve months ending in January, which was the same increase for the prior period. In our opinion, this does not signal inflationary pressure. Another barometer used to gauge inflation is the Employment Cost Index, which measures compensation costs such as wages and benefits paid by employers. The January report showed that it is also holding steady.
In conclusion, we do not believe that stocks are in a bubble despite growing concerns about valuation. This view is dependent on our belief that both inflation and interest rates will stay low and that 2021 earnings will continue to be revised higher as the global economy reopens. For these reasons, we remain overweight equities and favor a mix of stable earnings growers and industries levered to reopening.
Important Disclosure Information
The comments above refer generally to financial markets and not RiverFront portfolios or any related performance. Opinions expressed are current as of the date shown and are subject to change. Past performance is not indicative of future results and diversification does not ensure a profit or protect against loss. All investments carry some level of risk, including loss of principal. An investment cannot be made directly in an index.
Chartered Financial Analyst is a professional designation given by the CFA Institute (formerly AIMR) that measures the competence and integrity of financial analysts. Candidates are required to pass three levels of exams covering areas such as accounting, economics, ethics, money management and security analysis. Four years of investment/financial career experience are required before one can become a CFA charterholder. Enrollees in the program must hold a bachelor’s degree.
Information or data shown or used in this material was received from sources believed to be reliable, but accuracy is not guaranteed.
This report does not provide recipients with information or advice that is sufficient on which to base an investment decision. This report does not take into account the specific investment objectives, financial situation or need of any particular client and may not be suitable for all types of investors. Recipients should consider the contents of this report as a single factor in making an investment decision. Additional fundamental and other analyses would be required to make an investment decision about any individual security identified in this report.
In a rising interest rate environment, the value of fixed-income securities generally declines.
When referring to being “overweight” or “underweight” relative to a market or asset class, RiverFront is referring to our current portfolios’ weightings compared to the composite benchmarks for each portfolio. Asset class weighting discussion refers to our Advantage portfolios. For more information on our other portfolios, please visit www.riverfrontig.com or contact your Financial Advisor.
Investing in foreign companies poses additional risks since political and economic events unique to a country or region may affect those markets and their issuers. In addition to such general international risks, the portfolio may also be exposed to currency fluctuation risks and emerging markets risks as described further below.
Changes in the value of foreign currencies compared to the U.S. dollar may affect (positively or negatively) the value of the portfolio’s investments. Such currency movements may occur separately from, and/or in response to, events that do not otherwise affect the value of the security in the issuer’s home country. Also, the value of the portfolio may be influenced by currency exchange control regulations. The currencies of emerging market countries may experience significant declines against the U.S. dollar, and devaluation may occur subsequent to investments in these currencies by the portfolio.
Foreign investments, especially investments in emerging markets, can be riskier and more volatile than investments in the U.S. and are considered speculative and subject to heightened risks in addition to the general risks of investing in non-U.S. securities. Also, inflation and rapid fluctuations in inflation rates have had, and may continue to have, negative effects on the economies and securities markets of certain emerging market countries.
Stocks represent partial ownership of a corporation. If the corporation does well, its value increases, and investors share in the appreciation. However, if it goes bankrupt, or performs poorly, investors can lose their entire initial investment (i.e., the stock price can go to zero). Bonds represent a loan made by an investor to a corporation or government. As such, the investor gets a guaranteed interest rate for a specific period of time and expects to get their original investment back at the end of that time period, along with the interest earned. Investment risk is repayment of the principal (amount invested). In the event of a bankruptcy or other corporate disruption, bonds are senior to stocks. Investors should be aware of these differences prior to investing.
Index Definitions:
Standard & Poor’s (S&P) 500 Index TR USD (Large Cap) measures the performance of 500 large cap stocks, which together represent about 80% of the total US equities market.
MSCI Emerging Markets Index NR USD (Emerging Market Equities) is an equity index that captures large and mid cap representation across 23 emerging markets (EM) countries.
MSCI Europe Index — represents the performance of large and mid-cap equities across 15 developed countries in Europe.
MSCI Japan Index — designed to measure the performance of the large and mid cap segments of the Japanese market.
RiverFront Investment Group, LLC (“RiverFront”), is a registered investment adviser with the Securities and Exchange Commission. Registration as an investment adviser does not imply any level of skill or expertise. Any discussion of specific securities is provided for informational purposes only and should not be deemed as investment advice or a recommendation to buy or sell any individual security mentioned. RiverFront is affiliated with Robert W. Baird & Co. Incorporated (“Baird”), member FINRA/SIPC, from its minority ownership interest in RiverFront. RiverFront is owned primarily by its employees through RiverFront Investment Holding Group, LLC, the holding company for RiverFront. Baird Financial Corporation (BFC) is a minority owner of RiverFront Investment Holding Group, LLC and therefore an indirect owner of RiverFront. BFC is the parent company of Robert W. Baird & Co. Incorporated, a registered broker/dealer and investment adviser.
To review other risks and more information about RiverFront, please visit the website at www.riverfrontig.com and the Form ADV, Part 2A. Copyright ©2021 RiverFront Investment Group. All Rights Reserved. ID 1526867
