
By Gary Stringer, Kim Escue and Chad Keller, Stringer Asset Management
Recent projections suggest the unprecedented coronavirus stimulus packages will increase the Federal deficit by approximately $2.6 trillion dollars this year and the total deficit will cross $3.7 trillion deficit for 2020. That’s a big bill to pay, and it just amplifies the existing growing U.S. debt burden.
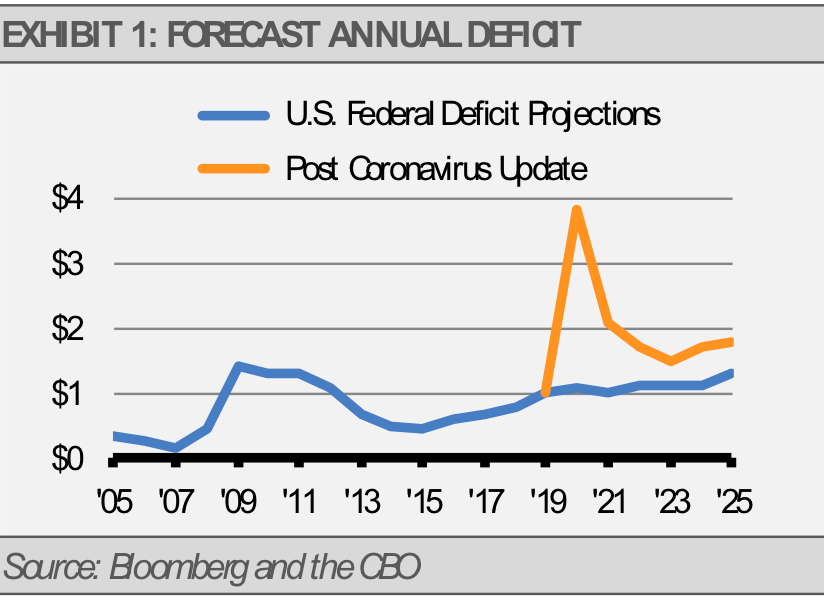
The Congressional Budget Committees’ (CBO) forecast prior to the pandemic estimated the debt held by the public to GDP ratio would approach near 100% by 2030. The additional debt being incurred due to the pandemic coupled with its impact on GDP this year will make this a potential reality this year according to the latest updates from the CBO.
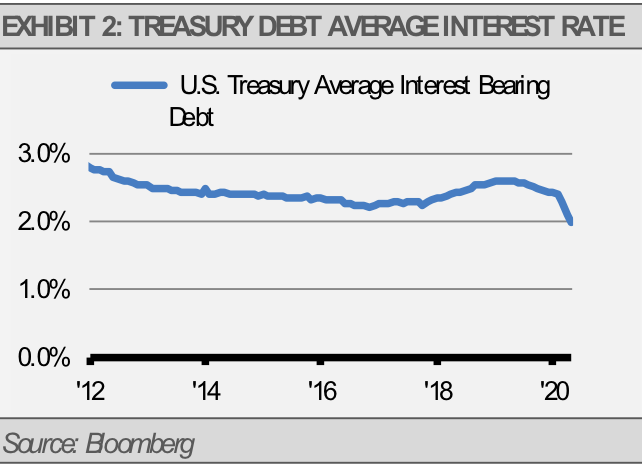
While debt levels of this magnitude are a potential hinderance for future economic growth, years of low interest rates and the recent drop in interest rates to record lows should reduce the strain. Even as the amount of debt outstanding has grown substantially, the average interest rate on U.S. Treasury debt has fallen over the years as older bonds mature and new bonds are issued in the lower rate environment of the last decade (exhibit 2). This decline can already be seen as recent securities are being issued at lower rates, which has caused a nearly 0.5% decline in the average interest rate on debt outstanding this year.
This scenario makes it easier for the government to carry larger amounts of debt at least over the shorter term. Looking at the actual interest expense the Treasury pays relative to GDP over various time periods can help demonstrate this concept.
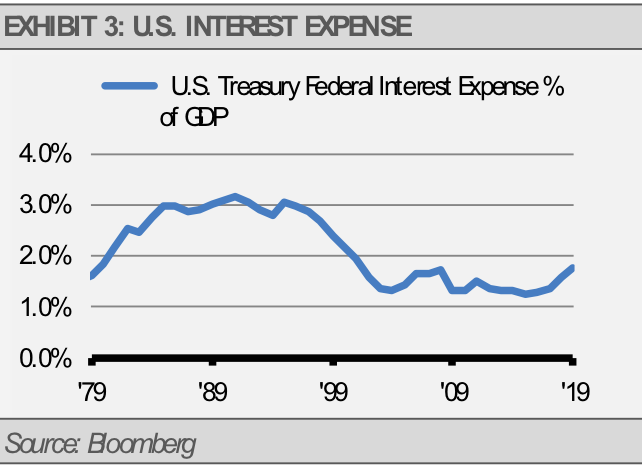
Since the 1940s, the interest expense as a percentage of GDP has averaged 1.69% with this number reaching highs above 3% in the late 1980s through the 1990s when average interest rates were higher and debt levels averaged five times lower. At the end of 2019, that number was slightly above the long-term average at 1.75%.
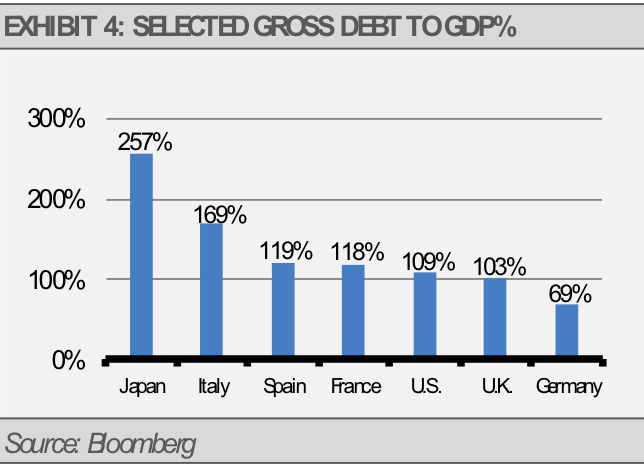
High debt to GDP ratios are not uncommon around the world as many countries operate at a deficit. On average, the U.S. has been running a deficit since 1962. Additionally, Japan has been managing a high deficit for decades, though lower interest rates have made it possible for Japan to successfully carry the higher debt load. The following exhibit compares gross debt to GDP, which is slightly different from the debt held by the public mentioned previously.
High levels can become a long-term problem if the country’s deficit spending is unsuccessful in boosting GDP growth to keep up with the debt burden. Additionally, the risk of rising interest rates in the future could significantly increase the interest expense.
While the U.S. debt burden needs to be addressed, the costs of COVID-19 aid have not pushed us too far over the edge from a debt servicing perspective, and we do not expect to see the government’s funding of this aid to be a hinderance to growth in the short-term. In fact, without the aid the chances for a rebound and our ability to get back on track would have been significantly reduced in our opinion. The recent strength in the equity and credit markets suggests this as well.
DISCLOSURES
Any forecasts, figures, opinions or investment techniques and strategies explained are Stringer Asset Management, LLC’s as of the date of publication. They are considered to be accurate at the time of writing, but no warranty of accuracy is given and no liability in respect to error or omission is accepted. They are subject to change without reference or notification. The views contained herein are not to be taken as advice or a recommendation to buy or sell any investment and the material should not be relied upon as containing sufficient information to support an investment decision. It should be noted that the value of investments and the income from them may fluctuate in accordance with market conditions and taxation agreements and investors may not get back the full amount invested.
Past performance and yield may not be a reliable guide to future performance. Current performance may be higher or lower than the performance quoted.
The securities identified and described may not represent all of the securities purchased, sold or recommended for client accounts. The reader should not assume that an investment in the securities identified was or will be profitable.
Data is provided by various sources and prepared by Stringer Asset Management, LLC and has not been verified or audited by an independent accountant.
