
By Jan van Eck, CEO for Van Eck Global
China has been a major contributor to global growth, and its economic activity tends to have significant repercussions for the global economy. To understand where the Chinese economy is in its growth cycle, we highlight a few key charts below, which may also provide context for the impact of the coronavirus.
Chinese Economy Health Check: PMIs

Source: Bloomberg. Data as of February 28, 2020. Data for Caixin Manufacturing PMI was not available prior to December 2016. Past performance is no guarantee of future results. Chart is for illustrative purposes only.
We believe purchasing managers’ indices (PMIs)1 are a better indicator of the health of the Chinese economy than the gross domestic product (GDP) number, which is politicized and is a composite in any case. The manufacturing and non-manufacturing, or service, PMIs have been separated in order to understand the different sectors of the economy, and the Caixin manufacturing PMI has a larger share of private companies. These days, the manufacturing PMI is the number to watch for cyclicality.
As expected, China’s official PMIs for February were hit hard, with the manufacturing PMI falling to 35.7 and the services PMI to 28.9. However, they add little to what we already knew from media reports and alternative activity measurements (commodity consumption, traffic and trade disruptions, environmental pollution, etc.). With this in mind, we are putting the February numbers behind us and looking forward to March PMIs, which may prove more valuable in gauging the speed of recovery. This may be of particular relevance to equity investors who appear to have faith in how authorities are managing the situation (judging by the performance of the Chinese equity market).
As a reminder, going into the coronavirus situation, private sector manufacturing was the weakest part of the Chinese economy, as measured by PMIs. This sector also faced relatively high interest rates, so it is what we will watch if and when the coronavirus episode ends.
A major trend that we would like to focus on is China’s growing number of corporate defaults. Offshore defaults reached USD3.6B in 2019 compared to USD3.3B in 2018, and onshore defaults rose to USD20B from USD17.5B in 2018. Generally, we would say that it is a healthy sign that risk is being priced into Chinese credit markets. A great background piece on this is actually Bloomberg’s Odd Lots podcast, “How Bond Defaults Are Changing China’s Markets,” which features a Chinese economist. However, China’s high-yield offshore borrowers will need to pay USD30B this year (including USD4.9B in March), which is one of the reasons why the market is watching spreads like in the chart below.
China Commercial Bank Bond AAA-A Spread, 1y

Source: Deutsche Bank
However, looking at actual yields for higher- and lower-rated companies and banks (rather than the spread between the two) shows the picture in a different light. The spread widening that took place between late November 2019 and later January 2020 was happening against the backdrop of falling yields – with yields on higher-rated bonds compressing a bit faster.
The chart below clearly shows that there has been some modest pickup in lower-rated bond yields in the past couple of weeks. So, the situation should be monitored carefully going forward. Our gut feeling is that yields of lower-rated bonds should grind up, pushing the spread with higher-rated bonds wider. There is anecdotal evidence that some Chinese companies previously under stress are now running into troubles – the HNA Group story is one good example, as the Chinese government has taken over management of the company’s debt.
China Commercial Bank 1Y Bond Yields
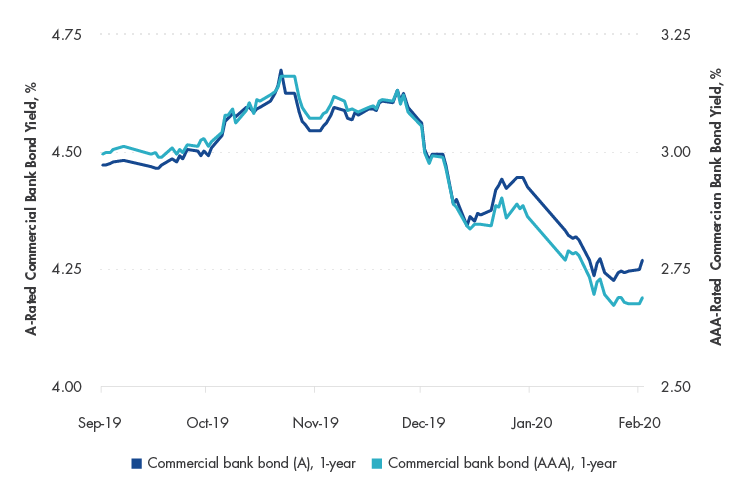
Source: Deutsche Bank
We are also keeping an eye on spreads between higher-rated (AAA) and mid-rated (AA) companies and banks. Some commentators believe/expect that these spreads may not widen too much because many mid-rated bonds are issued by local government financing vehicles. If the opposite happens, this may be an indication of deeper financial distress or that a government affiliation may not mean the inability of an issuer to default.
Understanding the Credit Cycle: Non-SOE Borrowing Costs

Source: UBS. Data as of February 25, 2020. Past performance is no guarantee of future results. Chart is for illustrative purposes only. Spreads are measured relative to average yield of 1, 3, 5, and 10-year bonds issued by the China Development Bank.
As with any economy, central bank policy is very important in China. In this chart, we can see that interest rates for the private sector fluctuate, whereas the interest rates paid by state-owned enterprises (SOEs) are pretty stable. Therefore, to understand the credit cycle, we point your attention to this private sector, or non-SOE, interest rate. It spiked in 2018, as a result of China’s crackdown on shadow banking2, meaning tougher lending conditions for the private sector. These interest rates began trending down in the winter of 2018 as the “drip stimulus” appeared to take effect.
The final point we would like to make is that funding costs for China’s private companies remain high. Part of the problem is that the transmission mechanism is not functioning properly, negating the impact of lower policy rates and reserve requirements. These companies were also disproportionately hit by the deleveraging drive. So, January’s policy reversal – shadow financing was up for the first time since March 2019 – was not particularly surprising. It was also not surprising that the government had just approved a special package (~0.6% of GDP in the form of lower social security payments) to help small and medium enterprises stay afloat.
DEFINITIONS AND DISCLOSURES
1Purchasing managers index (PMI) is an economic indicator derived from monthly surveys of private sector companies. A reading above 50 indicates expansion, and a reading below 50 indicates contraction.
2Shadow banking comprises private credit intermediation occurring outside the formal banking system.
Please note that Van Eck Securities Corporation (an affiliated broker-dealer of Van Eck Associates Corporation) offer investment products that invest in the asset classes discussed in this commentary.
This is not an offer to buy or sell, or a solicitation of any offer to buy or sell any of the securities mentioned herein. The information presented does not involve the rendering of personalized investment, financial, legal, or tax advice. Certain statements contained herein may constitute projections, forecasts and other forward looking statements, which do not reflect actual results, are valid as of the date of this communication and subject to change without notice. Information provided by third party sources are believed to be reliable and have not been independently verified for accuracy or completeness and cannot be guaranteed. The information herein represents the opinion of the author(s), but not necessarily those of VanEck.
All investing is subject to risk, including the possible loss of the money you invest. As with any investment strategy, there is no guarantee that investment objectives will be met and investors may lose money. Diversification does not ensure a profit or protect against a loss in a declining market. Past performance is no guarantee of future results.
