
Sage’s base case going into 2020 is a market environment characterized by stabilizing growth, low inflation, and continued monetary and fiscal policy support. The following are five themes that will impact market performance in 2020.
To listen to Sage’s 2020 market outlook podcast and how we are positioned for the first half, click here.
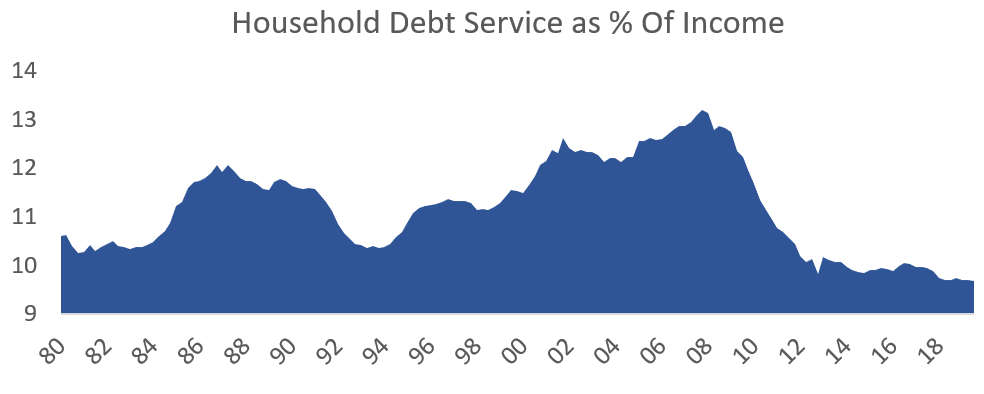
1. The U.S. Consumer – The domestic household sector remains the engine of U.S. economic growth. Household debt service capabilities are the healthiest they’ve been in over 30 years, and the labor force continues to expand, with the unemployment rate continuing to fall to cycle lows.
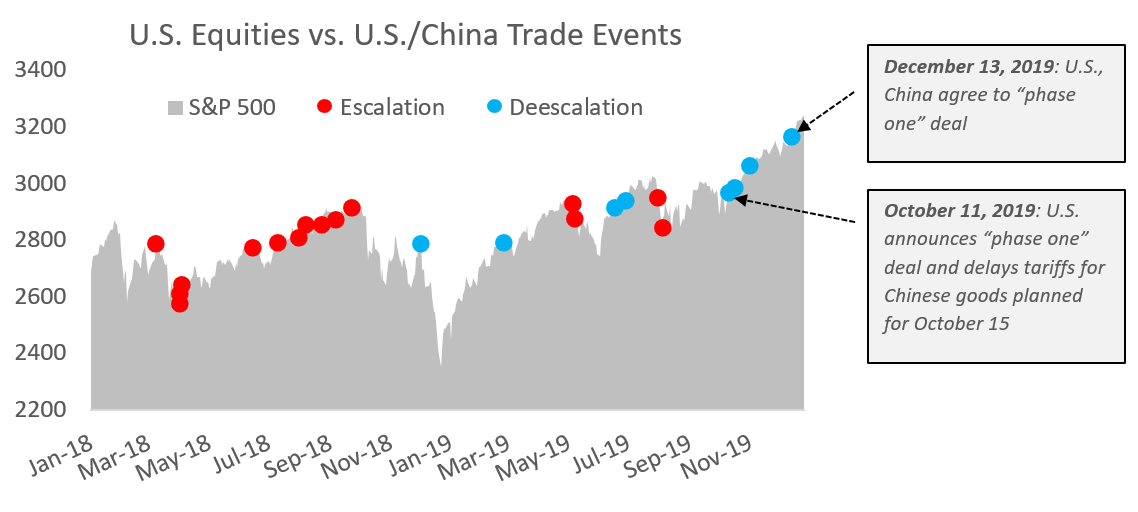
2. The Trade War – 2019 was a year of de-escalating trade tensions, culminating in a “phase one” trade deal between the U.S. and China. Easing of trade tensions was a contributing factor in the late-year rally. If the status quo holds, trade issues should remain in the background. A quiet period of trade rhetoric would dampen volatility and lift economic sentiment.
3. Central Bank Accommodation – After years of balance sheet contraction due to tighter monetary policy, global central bank balance sheets expanded in 2019, as global central banks enacted easy money policies in the face of slowing economic growth. Central banks are not expected to change policy course in 2020, which should continue to provide support to financial assets.
![]()
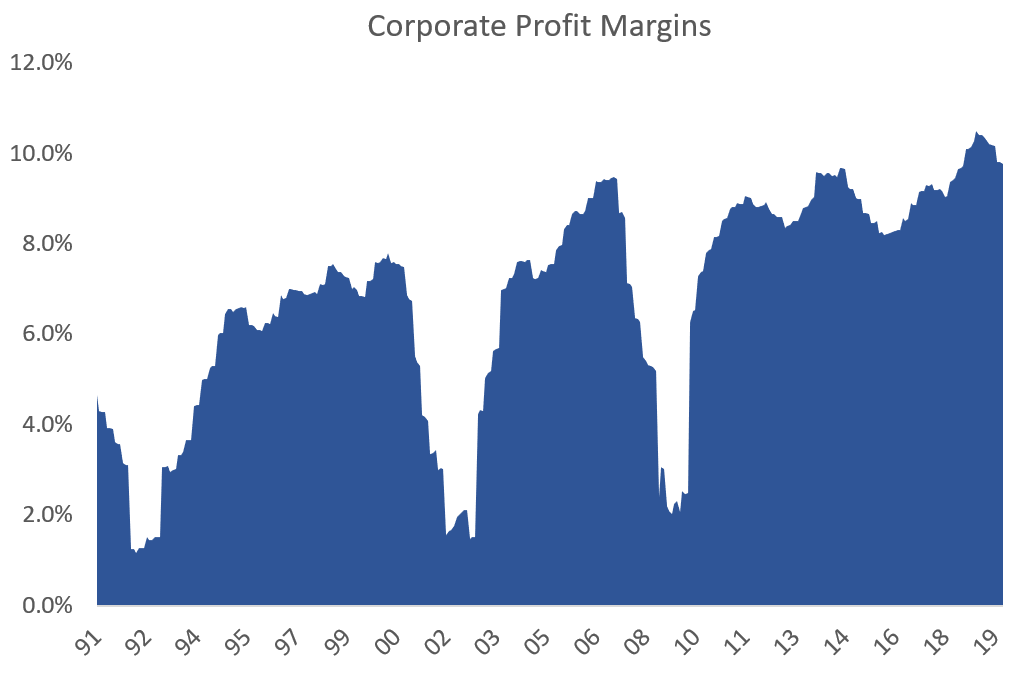
4. Corporate Earnings — A recovery in economic activity coupled with low inflation will be required for strong corporate earnings growth. Although corporate profit margins are at a 30-year high, inflation could raise costs and negatively affect corporate profitability.
5. The Presidential Election — Over the past 90 years, equities and fixed income have typically fared well during presidential election years, with 19 of 23 election years resulting in positive equity returns and 21 of 23 years resulting in positive returns for U.S. Treasuries.
S&P 500 and Treasuries Returns (23 Presidential Elections 1928-2016)
| S&P 500 Total Return | 10Y U.S. Treasury Note Total Return | Election | |
| 1928 | 43.81% | 0.84% | Hoover vs. Smith |
| 1932 | -8.64% | 8.79% | Roosevelt vs. Hoover |
| 1936 | 31.94% | 5.02% | Roosevelt vs. Landon |
| 1940 | -10.67% | 5.40% | Roosevelt vs. Willkie |
| 1944 | 19.03% | 2.58% | Roosevelt vs. Dewey |
| 1948 | 5.70% | 1.95% | Truman vs. Dewey |
| 1952 | 18.15% | 2.27% | Eisenhower vs. Stevenson |
| 1956 | 7.44% | -2.26% | Eisenhower vs. Stevenson |
| 1960 | 0.34% | 11.64% | Kennedy vs. Nixon |
| 1964 | 16.42% | 3.73% | Johnson vs. Goldwater |
| 1968 | 10.81% | 3.27% | Nixon vs. Humphrey |
| 1972 | 18.76% | 2.82% | Nixon vs. McGovern |
| 1976 | 23.83% | 15.98% | Carter vs. Ford |
| 1980 | 31.74% | -2.99% | Reagan vs. Carter |
| 1984 | 6.15% | 13.73% | Reagan vs. Mondale |
| 1988 | 16.54% | 8.22% | Bush vs. Dukakis |
| 1992 | 7.49% | 9.36% | Clinton vs. Bush |
| 1996 | 22.68% | 1.43% | Clinton vs. Dole |
| 2000 | -9.03% | 16.66% | Bush vs. Gore |
| 2004 | 10.74% | 4.49% | Bush vs. Kerry |
| 2008 | -36.55% | 20.10% | Obama vs. McCain |
| 2012 | 15.89% | 2.97% | Obama vs. Romney |
| 2016 | 11.77% | 0.69% | Trump vs. Clinton |
| S&P 500 | 10Y U.S. Treasury Note | |
| Average (Election Years) | 11.06% | 5.94% |
| % Positive (Election Years) | 82.6% | 91.3% |
| Average (All Years) | 11.36% | 5.10% |
| % Positive (All Years) | 72.5% | 81.3% |
This article was contributed by the team at Sage Advisory, a participant in the ETF Strategist Channel.
Disclosures: This is for informational purposes only and is not intended as investment advice or an offer or solicitation with respect to the purchase or sale of any security, strategy or investment product. Although the statements of fact, information, charts, analysis and data in this report have been obtained from, and are based upon, sources Sage believes to be reliable, we do not guarantee their accuracy, and the underlying information, data, figures and publicly available information has not been verified or audited for accuracy or completeness by Sage. Additionally, we do not represent that the information, data, analysis and charts are accurate or complete, and as such should not be relied upon as such. All results included in this report constitute Sage’s opinions as of the date of this report and are subject to change without notice due to various factors, such as market conditions. Investors should make their own decisions on investment strategies based on their specific investment objectives and financial circumstances. All investments contain risk and may lose value. Past performance is not a guarantee of future results.
Sage Advisory Services, Ltd. Co. is a registered investment adviser that provides investment management services for a variety of institutions and high net worth individuals. For additional information on Sage and its investment management services, please view our web site at www.sageadvisory.com, or refer to our Form ADV, which is available upon request by calling 512.327.5530.
