Myth 2: ETFs Detract from Price Discovery: Has one of the useful economic functions of markets – asset price discovery – been impaired by ETFs? If fewer people are using active management does that imply a less useful price signal?
The extent to which and how long individual assets are “mispriced”, or do not properly reflect fundamentals is a concern often voiced by critics of ETF and index investing AUM growth. While the topic is admittedly complex, we can attempt to alleviate these concerns by first examining shifts in the dynamic between cash trading volumes and ETF volumes in the current market.
In Myth 5, we go into greater depth to exhibit that ETF trading volumes represent a small percentage of cash trading of underlying stocks and bonds over time. At the same time, a noticeable trend across equity and fixed income markets is that cash security trading in these markets has become more efficient; equities have shifted predominantly to electronic trading, and bond trading is better facilitated by platforms such as Market Axess.
Across the asset management industry, passive vehicles have grown to represent 24% of all AUM, up from just 10% in 2007 (source: Morningstar, DWS calculations). A reasonable conjecture might be that the resulting dispersion across stocks would diminish, as passive investors are indiscriminately buying each stock at its current market weight, either directly or through the ETF. Dispersion is often viewed as a strong indicator of the opportunity set for alpha generation through material differentiation between fundamentally overvalued and undervalued stocks. Along the same lines, low levels of correlation and high levels of idiosyncratic risk might typically indicate a healthy market for fundamental price discovery.
In Myth 1, we touch on S&P 500 realized correlations as not having obviously increased over the past decade as passive AUM has gained market share.
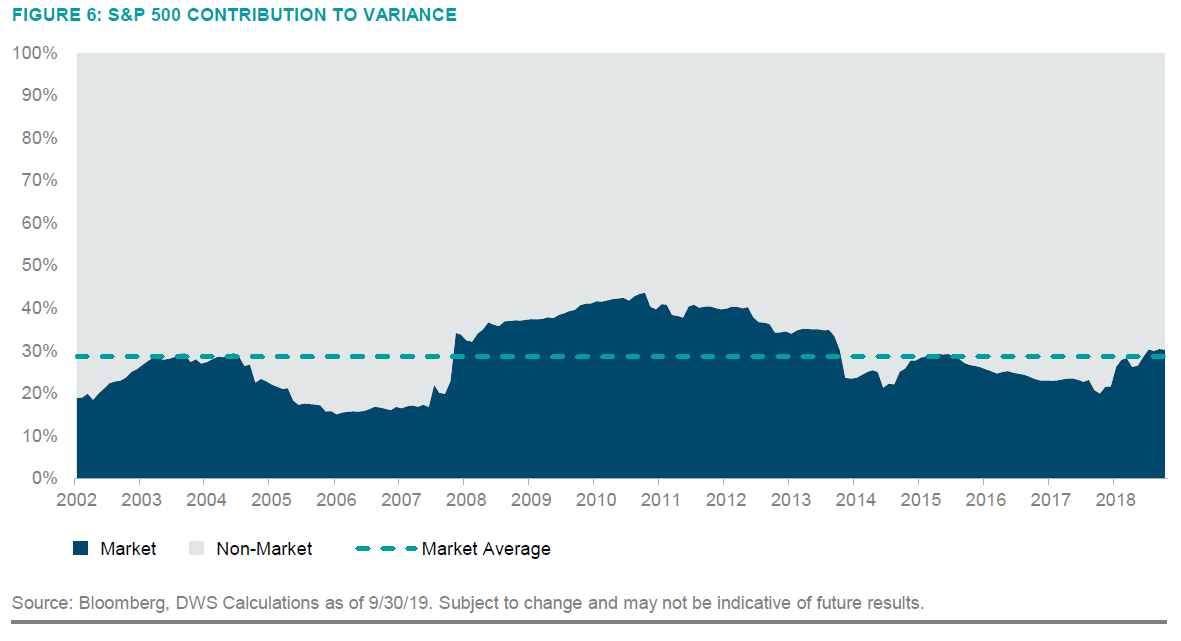
Along the same lines, invoking the Capital Asset Pricing Model or (CAPM) framework, we can break the S&P 500 into two components: 1. systematic or market risk, and 2. idiosyncratic or non-market risk. The figure below shows that over the past 2 decades, the proportion of idiosyncratic, often referred to as company-specific risk, as a percentage of the total variance of the S&P 500 has been largely unchanged, other than a spike in market risk during the Global Financial Crisis.
Although there are other factors at play, the lack of a clear trend higher in the prevalence of systematic or market risk suggests that moves in the prices of S&P 500 constituents are still largely determined by idiosyncratic company-specific factors even as passive investments have grown in size.
There is an argument to be made that diminishing analyst coverage of companies across banks and asset managers would eventually be reflected in less rational prices based on less complete information. There is certainly a link between the shift from active management into lower cost ETFs and index products, but it’s difficult to distinguish just how much of the decline in analyst coverage is directly caused by these flows vs. other factors such as reform measures (MiFidII) and client coverage models.
Whether alpha generation across the asset management community has been challenged because of less efficient markets or flows into passive is unlikely to be resolved with any degree of confidence. We can, however, see that the universe of potential active share still demonstrates similar levels of company-level price dispersion that at least provide a toolkit for differentiable returns.
