
By Gary Stringer, Kim Escue and Chad Keller, Stringer Asset Management
As our process allows us to manage risk in real time, we have adjusted our Strategies to weather market volatility while still participating in potential market appreciation. Recent news that Brexit may be delayed and that trade talks between the U.S. and China have restarted has offered some relief to the global markets. It remains our contention that while these headlines reflect risks to some economies around the world, they are not fundamental risks to the U.S. economy. As we have stated previously, nearly 90% of U.S. economic activity occurs within our borders.
Rather than focus on headlines, we are primarily watching indicators that tend to forecast global economic trends. Some of our longest lead time indicators are suggesting caution, but our more near-term indicators continue to point to slow growth ahead.
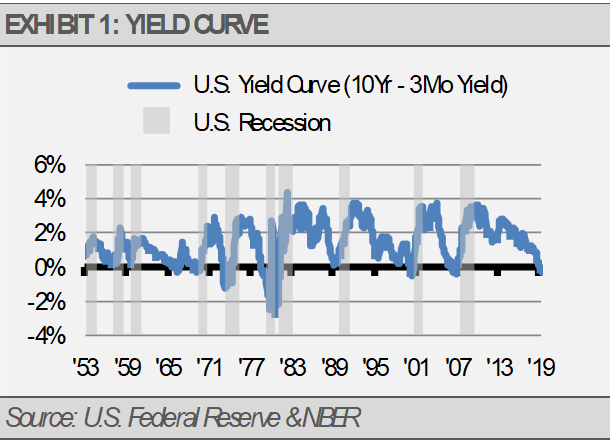
Turning to the U.S., long lead time indicators, such as automobile production, housing construction and the yield curve, are indicating risks to the business cycle ahead.
For example, the yield curve, which is the difference in interest rates between short-term and long-term Treasury Bonds, is one of the many indicators we track to gauge the probability for future recession. When long-term interest rates are higher than short-term interest rates, it’s a signal for positive economic growth ahead. Conversely, when short-term interest rates are higher than long-term interest rates, as they are today, it’s forecasting economic contraction ahead. However, this long lead time indicator may be up to two years early and a lot can happen in that time.
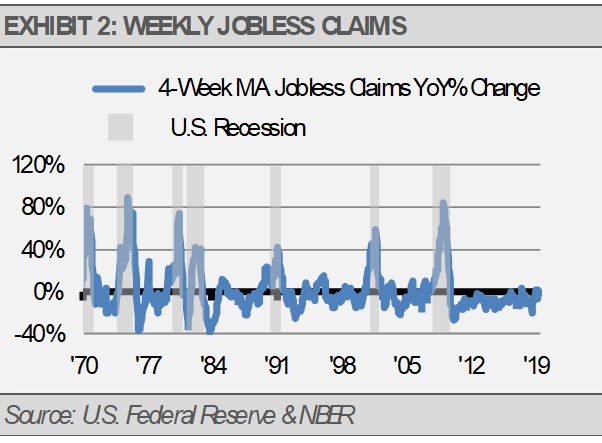
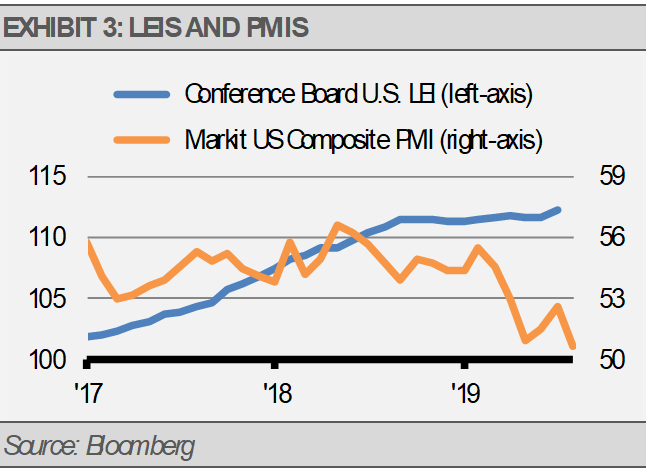
Our more near-term indicators, such as weekly jobless claims, purchasing manager indices (PMIs), and the Conference Board’s Leading Economic Indicators (LEIs) suggest continued, though slower, economic growth ahead. Consider that in the runup prior to many recessions, jobless claims spiked 15-20% from the previous year’s levels to signal economic decline in the coming months. At this point, jobless claims are holding steady, which suggests more muted economic growth.
The LEIs for July showed a rebound from slight declines in May and June (exhibit 3). However, available August surveys, such as the composite PMI, suggest slow economic growth for the month. Sideways or upwards trending LEIs indicate growth as do PMIs above 50. Declining LEIs and PMIs significantly below 50 indicate contraction. We expect that the August LEIs, when published later in September, will also reflect slower U.S. economic growth. Still, these fundamental measures of our economy are well above recessionary levels.
Slow economic growth is still growth and can lead to higher corporate revenues, earnings, and stock prices. As a result, we are fully, though defensively, invested. While we do see some troubling signs for the economy, the preponderance of our indicators suggest caution, but not a retreat.
We have focused on areas of stability in large, high-quality U.S. companies with our global equity exposures generally focused on low volatility, as well as the consumer staples, health care, and infrastructure industries. Additionally, we favor high-quality and liquid fixed income. At this point, we are shying away from economically sensitive investments overall.
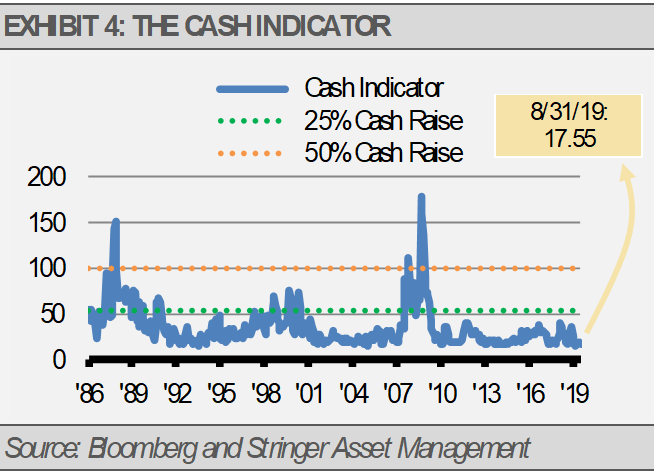
THE CASH INDICATOR
The Cash Indicator (CI) has been range bound at low levels yet moving with the markets. These low levels suggest to us that, while we are far from a crisis, markets are too complacent. Therefore, we expect volatility to again increase. Still, the fundamental economic backdrop looks solid. The defensive measures we have taken should help our Strategies hold up relatively well during volatile periods while still participating in the potential market gains that we expect.
This article was written by Gary Stringer, CIO, Kim Escue, Senior Portfolio Manager, and Chad Keller, COO and CCO at Stringer Asset Management, a participant in the ETF Strategist Channel.
Asset Management LLC’s as of the date of publication. They are considered to be accurate at the time of writing, but no warranty of accuracy is given and no liability in respect to error or omission is accepted. They are subject to change without reference or notification. The views contained herein are not be taken as an advice or a recommendation to buy or sell any investment and the material should not be relied upon as containing sufficient information to support an investment decision. It should be noted that the value of investments and the income from them may fluctuate in accordance with market conditions and taxation agreements and investors may not get back the full amount invested. Past performance and yield may not be a reliable guide to future performance. Current performance may be higher or lower than the performance quoted.
The securities and strategies identified and described may not represent all of the securities purchased, sold or recommended for client accounts. The reader should not assume that an investment in the securities identified was or will be profitable.
Data is provided by various sources and prepared by Stringer Asset Management LLC and has not been verified or audited by an independent accountant.
