By Scott Opsal, Director of Equities, The Leuthold Group
Quality is one of the most popular and successful of the equity market’s quant factors. It is intuitively appealing and serves as a useful defensive strategy in falling markets. Low Volatility and Dividend Growth are also defensive factors, while Momentum and High Beta are viewed as aggressive or bullish factors. These offsetting behaviors would seem to make for excellent diversification opportunities in equity portfolios, and for the most part, that is true.
However, we note that Quality failed to display its defensive personality in the fourth quarter selloff, throwing a wrench into the workings of portfolio diversification and downside protection.
Recent Returns
As a traditionally defensive attribute, we would expect Quality to underperform in strong up markets. That proved true in the bull market’s spectacular run from 2/11/16 through 1/26/18, when the S&P 500 gained a total return of 63.5%.
Chart 1 illustrates that High Quality (measured by the S&P 500 Quality Index) lagged the parent S&P 500 index by nearly 10% during the peaking process. We wondered whether this shortfall was due to the Tech sector’s dominance during that period, so we also assessed the Sector Neutral Quality Index produced by MSCI. This measure lagged the parent MSCI USA Index by 7%, suggesting that Quality itself, rather than sector weightings, accounted for the bull market deficit.
Chart 1

While the blow-off phase of the bull run found Quality’s performance lagging, as expected, we were drawn to its lack of protection in the final quarter of 2018. Looking for Quality to buffer losses in the bearish decline, we instead observed that Quality lagged the core indexes on the way down as well. Chart 2 demonstrates that both Quality measures failed to beat their parent indexes as the S&P 500 dropped 14% from the September 20th high through year end. Even measured at the December 24th low, when the S&P 500 was down 19.4% from its September peak, Quality’s excess return was a no-show.
Chart 2
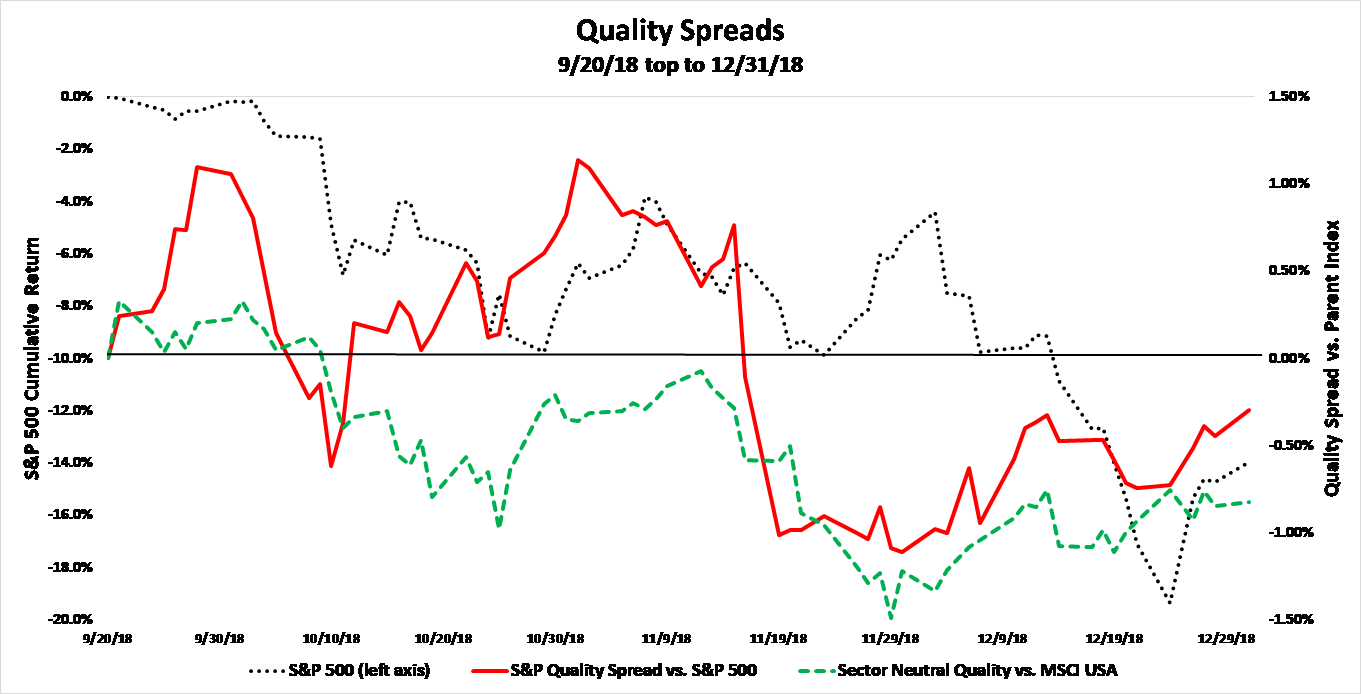
Table 1 reveals that the most popular Quality-focused ETFs also fared worse than the S&P 500 during the fourth quarter.
Table 1: Quality ETF Performance in 4Q 2018
What might account for this incongruent behavior, given the clear differences in market psychology and style performance during these two periods? Our research focused on several topics for further investigation.
Is Quality Really Defensive?
We took a deeper look at several smart beta factors to confirm that they deserve their defensive reputations. This analysis considers monthly returns over the past 20 years by bucketing returns into up or down months as measured by the S&P 500. Our defensive hypothesis predicts that Quality, Low Volatility, and Dividend Growth (represented by the S&P 500 Dividend Aristocrats) would perform slightly worse in up markets but make up for that by protecting in down markets. Table 2 presents the “hit rates” for each factor, illustrating how often they outperform or underperform the S&P 500, depending on the market’s overall direction.
Table 2

This analysis shows that defensive factors do underperform in up months but outperform in a large percentage of down months. Interestingly, Quality is the least extreme of the defensive factors, outperforming in more than 47% of up months and protecting in 76% of down months, compared to more than 80% protection from Volatility factors.
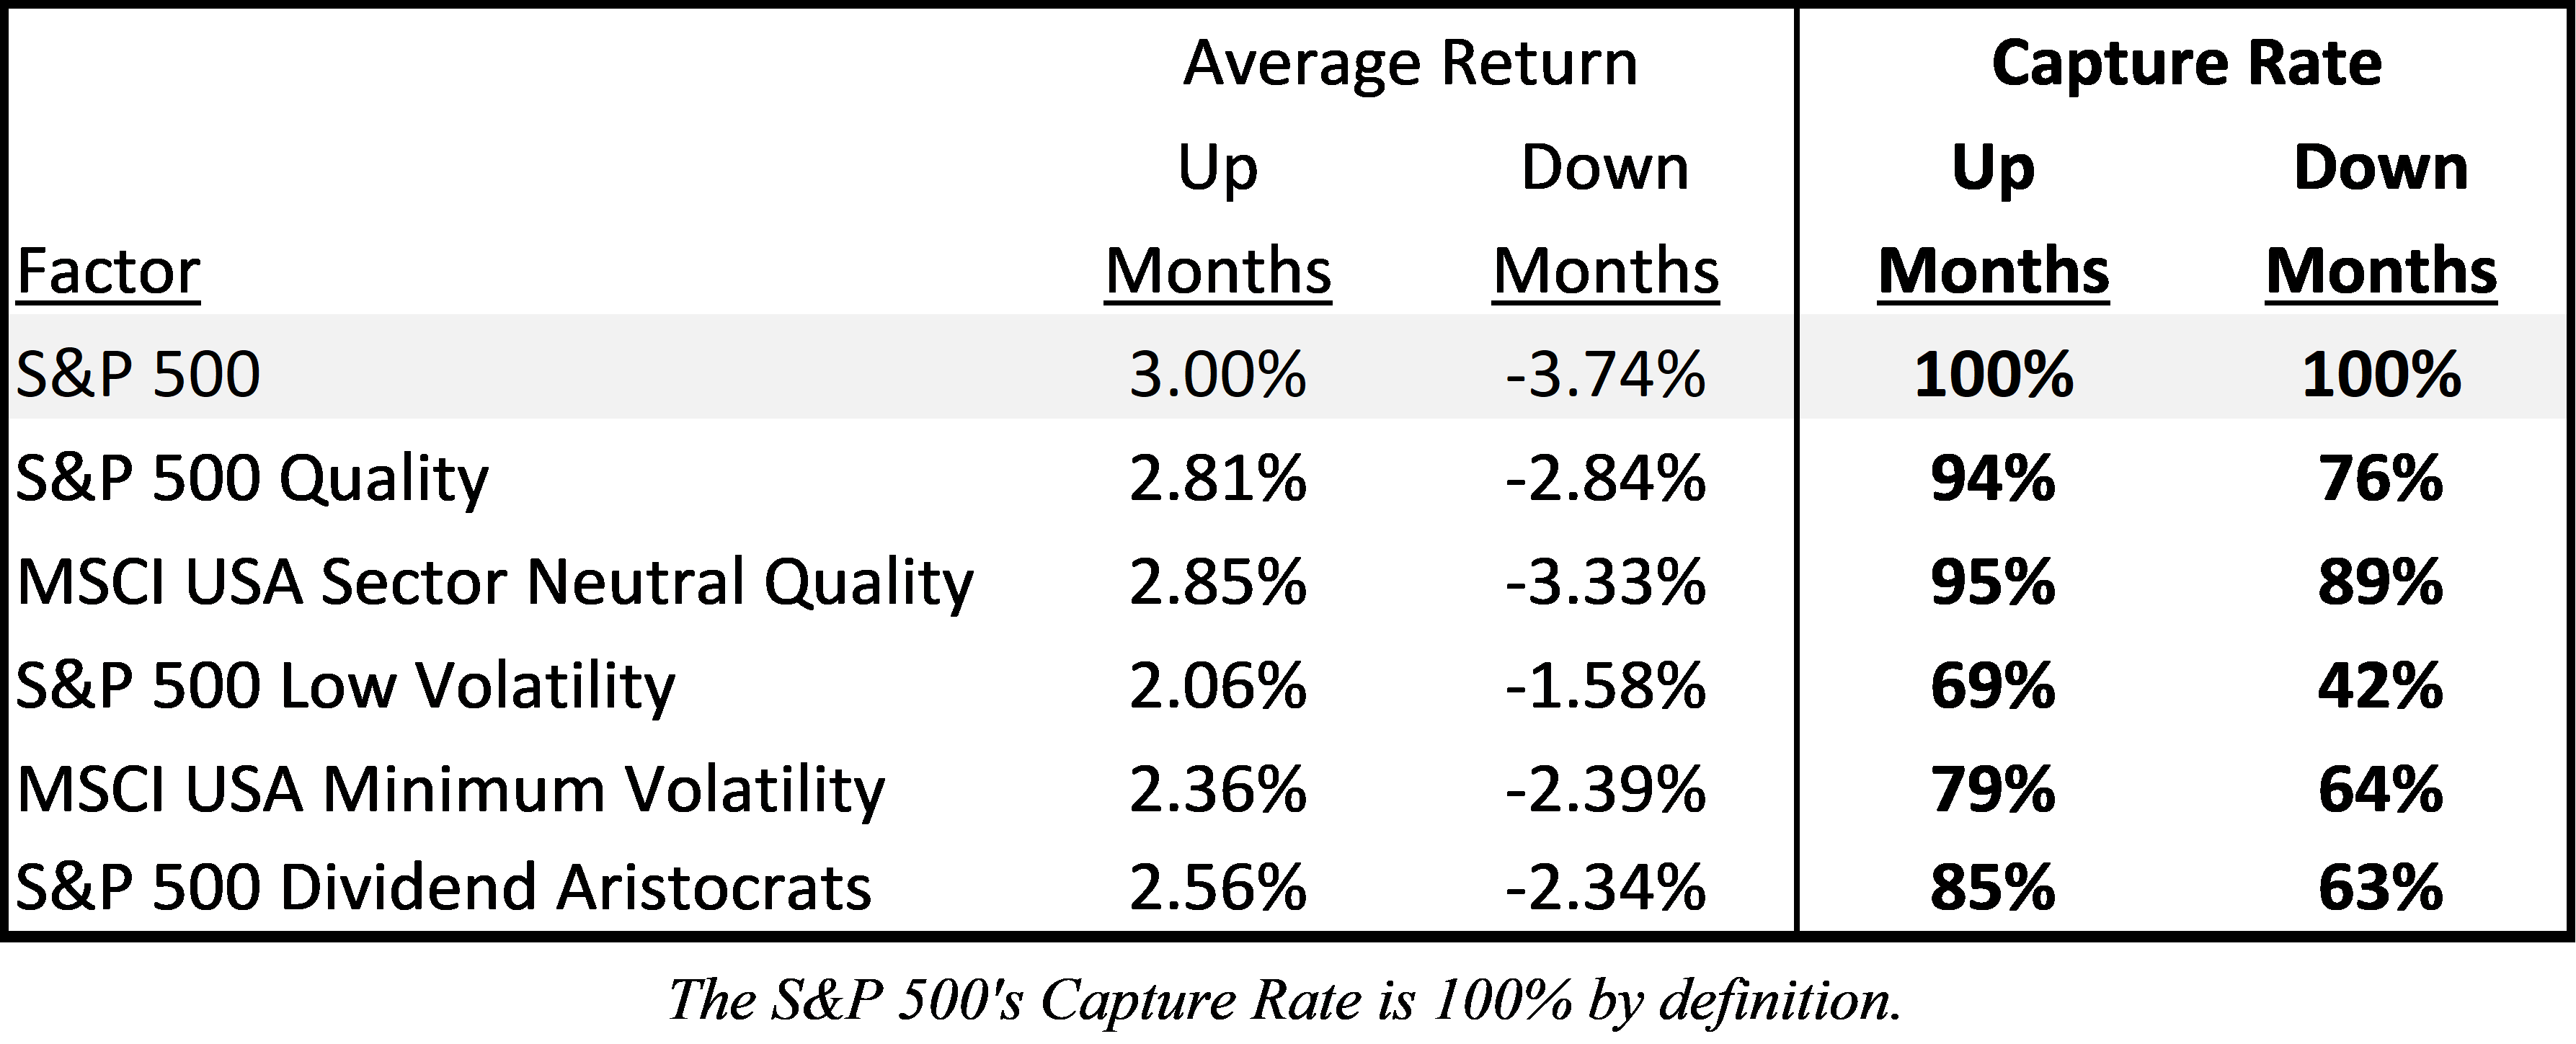
Table 3 displays factor defensiveness using capture rates, a calculation widely used by mutual fund analysts. Capture rate measures the percentage participation of an investment in up and down periods. When selecting defensive factors, the most important statistic is having a participation rate in down markets that is well below 100%. A lower downside-capture percentage means the asset generally falls less than the market, and we see that each of our defensive candidates passes this test. Quality participates the most in positive months and falls 76% as fast as the market in down months. Volatility and Dividend factors appear to provide more resilience in down markets but offer less upside capture in rising markets, giving the investor a range of choices in setting their risk/return tradeoffs.
Table 3
Diversification And Correlations
Not only did Quality fail to provide downside protection in the fourth quarter of 2018, the diversification effect of mixing factors together also failed to materialize. Chart 3 shows the 21-day rolling correlations between factors during 2018, depicting a complete change in behavior as the market topped out in late September. During the turbulence in February, correlations tightened into the mid-90% range for all factors. The summer’s grind higher saw Quality stick tight to the broad market while Low Volatility and Dividend Growth broke off as the Social/Mobile/Cloud phenomenon reached its peak. As the market topped on September 20th and began a rapid decline into year end, correlations jumped quickly, with Low Volatility remaining the best diversifier.
