By Tony Barchetto, Salt Financial
- Beta is just an estimate using historical returns to forecast the future.
- Several traditional methods vary in accuracy but all generally do a poor job of estimating very high and very low betas.
- Persistent bias in underestimating low beta and overestimating high beta may explain part of the “low beta anomaly”
“Beta” as a term is more prevalent in the investing lexicon today. Often shorthand for plain vanilla, market capitalization-based exposure to the market, “beta” has become a commodity. Investors can put on “cheap beta” with an ETF at a cost of close to zero. Then of course there’s “smart beta”, which tries to one-up the old dumb beta by tilting the index with different weights or targeting factors in search of higher risk-adjusted returns. Large asset managers and investment banks are getting in on the act, conjuring up new “Head of Beta Strategies” roles or marketing “strategic beta” funds as a style alongside the traditional active Morningstar box styles of growth and value. But what does “beta” really mean? Does it describe anything useful?
Professionals and many individual investors are familiar with beta and its typical interpretation. A stock with a beta of 1.0 will tend to move in the same direction and magnitude as the market. Stocks with betas more than or less than 1.0 will tend to be more or less volatile than the market respectively. A stock with a beta of 1.30 would be expected to vary 30% more than the market. If the market appreciates 10% this quarter, does that mean the stock will go up 13%? Not always. In fact, many times it will be significantly different.
Why?
A stock’s beta is only an estimate of its future sensitivity to the market. In the absence of a crystal ball, we only have the past as a guide to the future. The most common way to measure and estimate beta is to use five years of monthly returns. This was used by Eugene Fama and James MacBeth in a 1973 paper testing some aspects of the CAPM and persists to this day. But does it work well? Market conditions can change dramatically over a five-year period. Sectors move in and out of favor, companies change their strategy, and competitors can enter the market, all potentially affecting how an individual stock will move with the broader market. To measure the accuracy of using these historical calculations of beta as a forecast, we calculated 5-year/monthly estimates and compared them to some other alternate methods.
Testing Beta Forecast Accuracy
For our analysis, we looked at the top 1,000 US stocks by market capitalization (as defined by the Solactive US Large & Midcap Index) from 2004 through 2017. We estimated beta for each stock at the beginning of each quarter and then compared it to the realized beta at the end of the quarter. In addition to using the traditional 5 year/monthly return method (“Monthly”), we also calculated beta using 1 year of daily returns (“Daily”) as well as Bloomberg’s Adjusted Beta (“Bloomberg”), which uses 2 years of weekly returns by default and then applies an adjustment factor. The Bloomberg adjustment takes the “raw” beta calculated using weekly returns, multiplies it by 0.67 and then adds 0.33. Mathematically, this will push the raw betas closer towards one, increasing lower betas and decreasing higher ones (more on this later).
Since individual stock betas are noisy, we sorted the 1,000 stocks each quarter into deciles by the historical Daily beta calculation and then measured the accuracy of each decile in each period as a portfolio of 100 stocks. The realized beta calculated from 1 year/daily returns at the end of each period was used as the benchmark for the ex-ante forecasted betas. Below is a table summarizing the forecast errors for each model:
![]()
![]()
The data show an improvement in accuracy in moving from Monthly to Daily, as measured by Mean Absolute Error (MAE, the average forecast error independent of sign) and Mean Squared Error (MSE, which squares the errors and punishes extreme outliers more severely). Bloomberg was the most accurate, with the lowest MAE and MSE. The push and pull of the raw betas towards one by the adjustment did have a material impact on accuracy.
The average error tells a different story. When using a model to predict values, an “unbiased” estimator will produce an average error very close to zero. This means the model will both over- and under-estimate predicted values but the distribution of these errors will cancel each other out. An average error that falls further away from zero indicates a level of bias in the estimator–a systematic leaning towards over- or under-estimation in the model.
The average error for the Monthly model was 0.047, indicating this model tends to over-estimate the beta for the next quarter. But the Daily and Bloomberg models were both very close to zero (0.0037 and 0.0001), suggesting they are unbiased in addition to being more accurate. However, this does not reveal the entire picture.
Averages are useful tools for summarizing data. They help provide context for a large number of data points that is very simple to understand. But they can also distort true meaning and mask additional insights that can be gleaned upon closer analysis. Sometimes additional statistics such as the median value, standard deviation, or skew provide additional color. But sometimes they don’t.
Think about this one for a second: the average person has one testicle. True statement in statistical terms, devoid of meaning in reality.
Capturing Highs and Lows
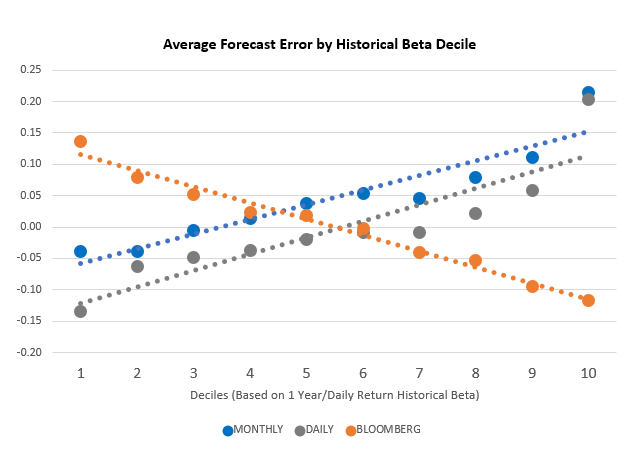
The key takeaway for this chart is the slope of the trendlines. As beta rises, the average error for the Monthly and Daily models overshoots in estimating higher betas and undershoots in estimating lower betas. For the Bloomberg estimate, it is the exact opposite. The adjustment that puts a finger on the scale by pushing the raw beta closer to one is the right idea but over-corrects in its implementation.
