By Dave Mazza, OppenhemerFunds
ETFs experienced strong inflows in November, adding more than $37 billion in net new flows. Inflows for the year now stand at a staggering $410 billion, an annual inflow record for the category and representing a 16.3% lift from the January 1 market cap of $2.5 trillion.
As more investors adopt ETFs, tracking passive flows can add timely insight into where capital is being allocated. In the month of November, we identified a few notable trends.
- Even with U.S. equity ETFs posting strong inflows in October and November, international equity ETFs remain in the lead this year.
- The Value factor has dominated smart beta flows so far this year, even with lagging performance.
- High-yield fixed income ETFs experienced choppy flows and ended the month nearly flat.
U.S. Equity on a Positive Trend but Trailing International Equity for the Year
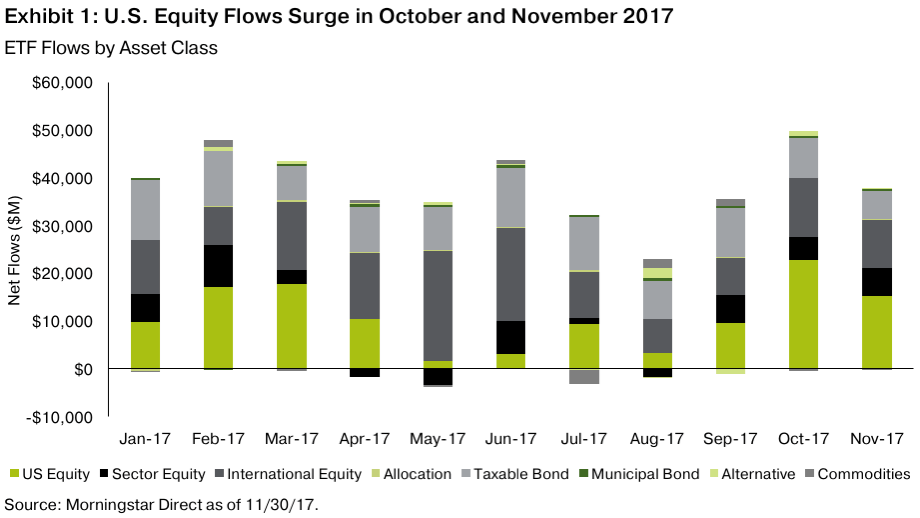
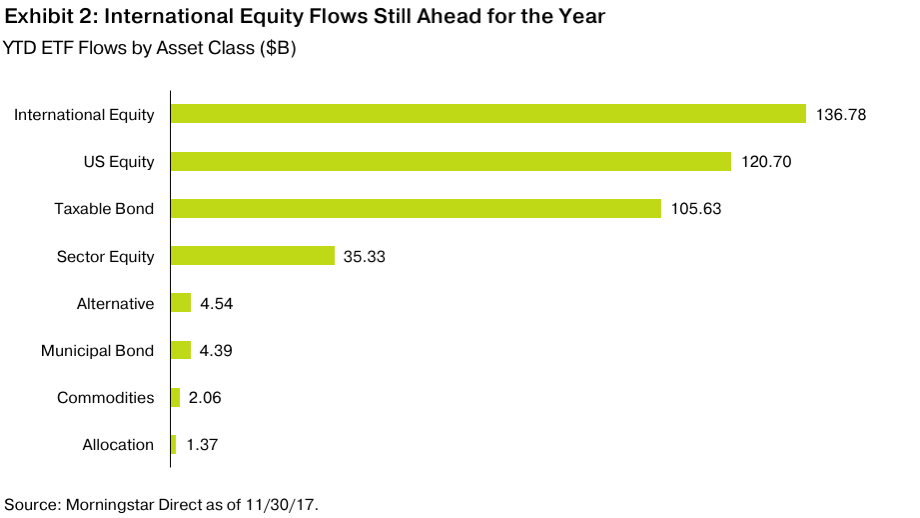
![]() Among asset classes, international equity set a surprisingly brisk pace for inflows in the second quarter, helped by outperformance. U.S. equity ETFs staged a comeback in the fourth quarter, with more than $38 billion in flows in October and November, compared to international equity’s respective $22 billion during the same time period. Yet international equity still sits atop the 2017 leaderboard, with nearly $137 billion in flows for the year, $16 billion ahead of U.S. equity.
Among asset classes, international equity set a surprisingly brisk pace for inflows in the second quarter, helped by outperformance. U.S. equity ETFs staged a comeback in the fourth quarter, with more than $38 billion in flows in October and November, compared to international equity’s respective $22 billion during the same time period. Yet international equity still sits atop the 2017 leaderboard, with nearly $137 billion in flows for the year, $16 billion ahead of U.S. equity.
Consumer Discretionary Rebounds
Looking at sector flows offers a more nuanced story, with various industries experiencing dynamic change month to month. The clearest example of this is in the Consumer Discretionary sector. Continued disruption and industry squeezing from e-commerce activity soured investors on traditional retailers, and sector flows followed: Year-to-date through October, Consumer Discretionary ETFs experienced more than $1 billion in outflows. However, the group surpassed rather low expectations for the Black Friday sales period and was further helped by the prospect for tax reform, enabling tailwinds to begin to form. The sector was up 7.33% in November, the top performer in the S&P 500 Index, and flows were the strongest they’ve been all year, with more than $1 billion in net flows, turning that year-to-date net outflow marginally positive.

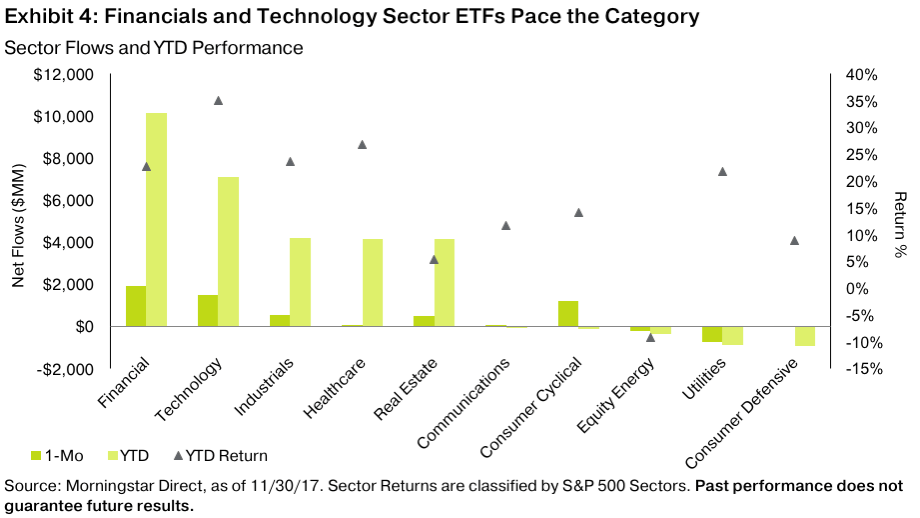
If we look more broadly across sectors, we see that Financials and Technology led the pack in both November and year-to-date, with nearly $18 billion in combined new flows. Both sectors have also experienced strong performance year-to-date. But examining sectors in which performance and flows don’t align may offer interesting clues about where the broad asset allocator may not be buying into the market exuberance. For example, Utilities are up nearly 22% this year, but this combination of performance and historically strong yield from the category has not yet enticed passive investors. Real Estate is an example of the opposite sort of trend – we’ve seen a healthy $6 billion of inflows into the sector, yet performance has lagged severely, in part the result of rising short-term borrowing costs.
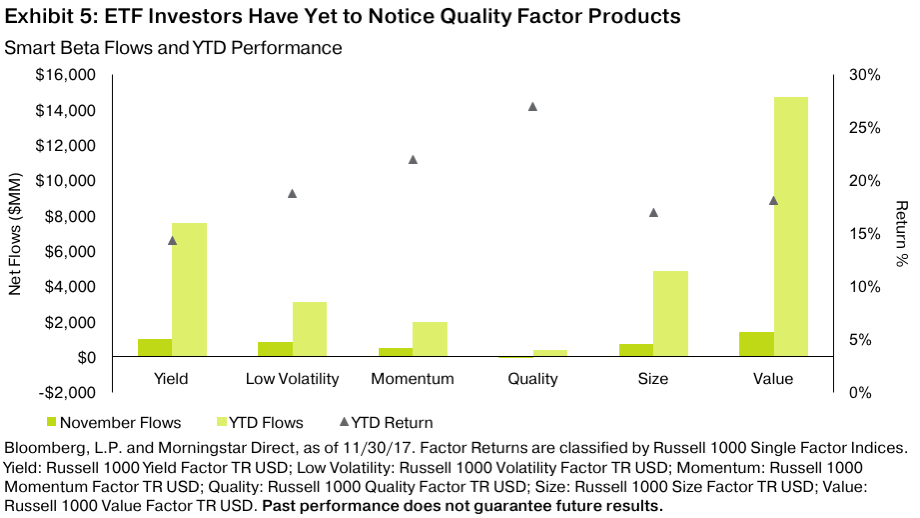
Value Has Dominated in 2017, Despite Lagging Performance
The Value factor has dominated smart beta ETF flows this year, despite its lackluster relative performance of 18% year-to-date, compared with 20.35% for the market and 26.90% for Quality. Surprisingly, ETFs that harness and isolate Quality, which is characterized by low leverage and high return on equity, were actually in net outflows of $9 million for the month of November. While Value and Size are well established in the investing community, other factors are just starting to gather momentum in portfolio construction. Year-to-date smart beta flows demonstrate that the Quality factor may have more work to do to entice the passive investing community.
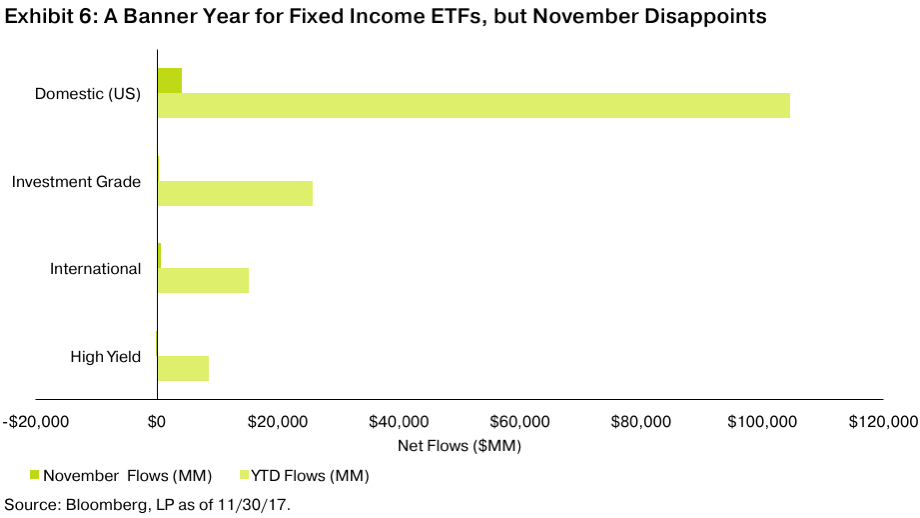
Fixed Income Inflows Dip in November
Both U.S. and international fixed income ETFs have garnered heightened attention and investor flows year-to-date – nearly $120 billion in total flows and a greater than 25% lift off the AUM base for year-end 2016. In November, however, flows had a slight hiccup, bringing in less than $5 billion in aggregate. Looking at high yield, November was only the third month this year that the category was in net outflows. Furthermore, high yield saw its worst weekly outflow since March of more than $2 billion for the week ending November 10. Exhibit 7 shows that flows tend to be highly correlated with high-yield fixed income performance, and while choppy, ended flat.