Note: This article appears on the ETFtrends.com Strategist Channel
By Scott Kubie, CFA
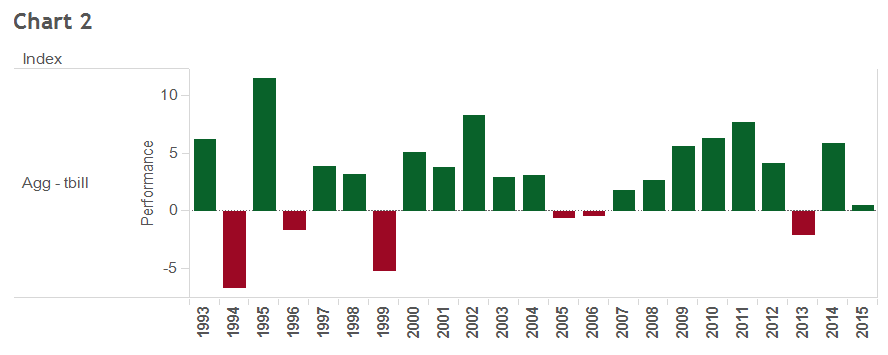
How risky can bonds be? They have only declined in three of the last 23 years, as measured by the Barclays U.S. Aggregate Bond Index and shown in Chart 1. Negative performance less than 13% of the time doesn’t seem very risky. Only two of those years, 1994 and 2013, posted returns lower than -2%, and all three negative years were followed by excellent returns. Hardly any risk there.
But bonds are much riskier than these numbers suggest. By modifying our assumptions slightly, the probability for negative returns increases to between 30% and 60%, and the potential loss increases to a much higher level than seen in Chart 1.
By examining the historical data more closely, we discover three differences that separate today’s market from its track record. By making modest analytical adjustments, the data leads to the conclusion that bonds aren’t as safe as expected.
Related: Factor Seasonality – Analyzing a Variety of Investing Behaviors
Adjustment 1: A Lower Risk-Free Rate
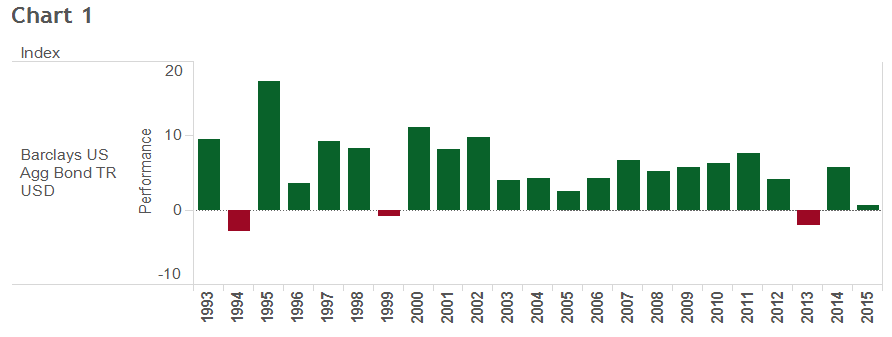
The data in Chart 1 benefits from a higher risk-free rate. Prior to 2008, T-Bills yielded above 4%. Chart 2 adjusts the historical return by subtracting the risk-free rate from the bonds. This chart shows the negative price returns from bonds are more frequent and significantly deeper than Chart 1. Since the current risk-free rate is near zero, this chart provides a better estimate of how far bond funds could decline in a given year.
For example, 1994 goes from losing 2.9% to dropping 6.7%. 1999, which was just barely negative, would have lost more than 5% if there wasn’t a positive T-Bill yield to support it.