Last week, the S&P GSCI Crude Oil gained 9.7% in one of its best weeks (24/1501) in history since 1987. It was the second best week in 2015, following its gain of 11.8% in the last week of Aug. Historically, with the exception of the bottom in 1988, there have been greater than 2 weeks of spikes bigger than last week’s before a bottom was hit. So maybe oil hasn’t hit a bottom yet by this metric, but it wouldn’t be completely unprecedented or unreasonable.
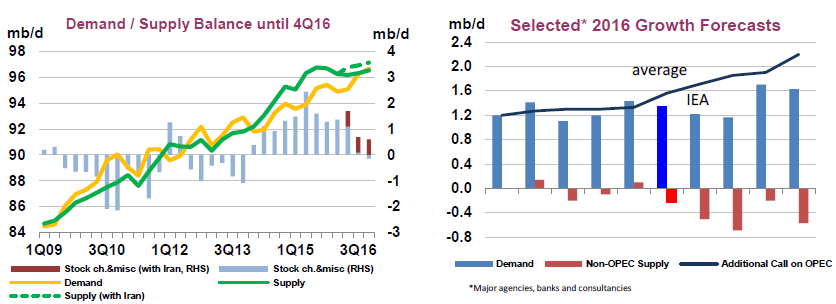
Although many supporting events happened simultaneously last week like a continued drop in US rig counts, concern about falling production in Canada and Bakken, the decision by the Fed to hold off on the interest rate hike and the Russian attacks on Syria, it’s difficult to make the case the rally is sustainable. Inventories are still very high and demand is questionable. According to the IEA’s Oil Market Report, “a projected marked slowdown in demand growth next year and the anticipated arrival of additional Iranian barrels – should international sanctions be eased – are likely to keep the market oversupplied through 2016.”
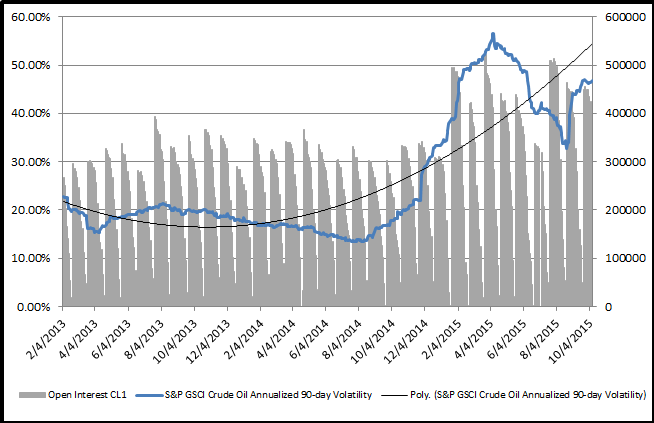
Last, one indicator that has historically crashed at the peak of volatility and oil bottom is open interest. It fell briefly but quickly elevated to its relatively high current level.
Despite this, there are calls on oil that call a bottom in this quarter or next, and quote a range of $75 by the end of 2017. PIRA energy group says the current market slump is setting the stage for prices to surge to $75 within two years, and below is a chart from Morgan Stanley of their oil market outlook, also showing oil in the $75 range for 2017.
