Barcode symbologies are mappings which allow humans and computers to communicate by simplifying the language into a code of bars and spaces that scanners can read. If complex information can be depicted so simply that a computer can read it, why not use a barcode to better understand oil? If you see the pattern below, congratulations – you might be a computer (or an oil analyst.) If you don’t see the pattern, then don’t worry – you’re human.
Let’s walk though the symbology that maps the above barcode to its underlying message. The first step in decoding the barcode is to show the labels of the chart.
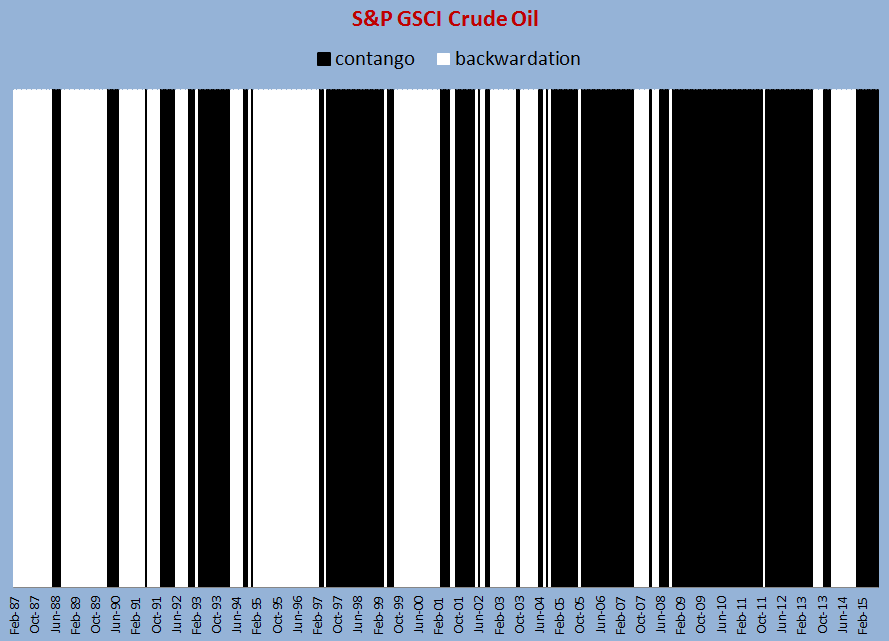
The chart is simple. It’s just binary; 0 for backwardation and 1 for contango, where a black bar represents a month of contango. (As a refresher, contango describes the shape of a forward curve when the contract expiring nearby is cheaper than the contract expiring further out. It is losing for a long only investor. Conversely, backwardation describes the shape of a forward curve when the contract expiring nearby is more expensive than the contract expiring further out. It is profitable for a long only investor.) Notice contango and backwardation tend to come mostly in thick lines, or in other words, there are several consecutive months of either backwardation or contango.
Why is this? Backwardation happens when there is a shortage, and contango happens when there is excess inventory. Since it takes time for inventories to build and deplete, the conditions persist. Not only do the conditions generally persist, they stubbornly persist. There are only 15 of 343 months where oil’s curve shape flipped for only a single month. It was twice as likely to see a shortage peek through for a month during contango than it was to see an excess during backwardation. That should make sense since it is harder to grow, mine and drill enough commodities to replenish inventories during a shortage than it is to buy cheap commodities in a glut.
If by glancing, you think it looks like contango happens more than backwardation, then you are correct. Historically, contango is measured just over half the time, in about 55% of months, and backwardation is measured in about 45% of months. However, backwardation is more potent. Not only is it harder for a surplus to interrupt a shortage but the average monthly return gained (roll yield) from backwardation is 1.7% versus 1.4% lost in months of contango.
On average since 1987, there is only a slightly negative roll yield of 2 basis points per month, but the contango since 2005 helped drive the S&P GSCI Crude Oil Total Return down to the lowest since 1999 (on Aug. 24, 2015,) wiping out an additional 10 years of gains for investors.
