Market volatility is a function of both dispersion and correlation, as shown in this schematic:
Dispersion measures the degree to which the components of an index perform similarly. If the components are tightly bunched, dispersion will be low and, other things equal, the index’s volatility will be low. Correlation is a measure of timing; it measures the tendency of index components to rise or fall at the same time. If the components tend to move together, correlation will be relatively high, and volatility will rise. If component moves tend to offset, correlation and volatility will be lower. In terms of our simple schematic, the farther from the origin an index is, the higher its volatility will be.
Dispersion, correlation, and volatility can be measured at the market index level, of course, but can equally well be measured at a finer level of granularity. Below we’ve graphed these metrics for each of the 10 sectors of the S&P 500:
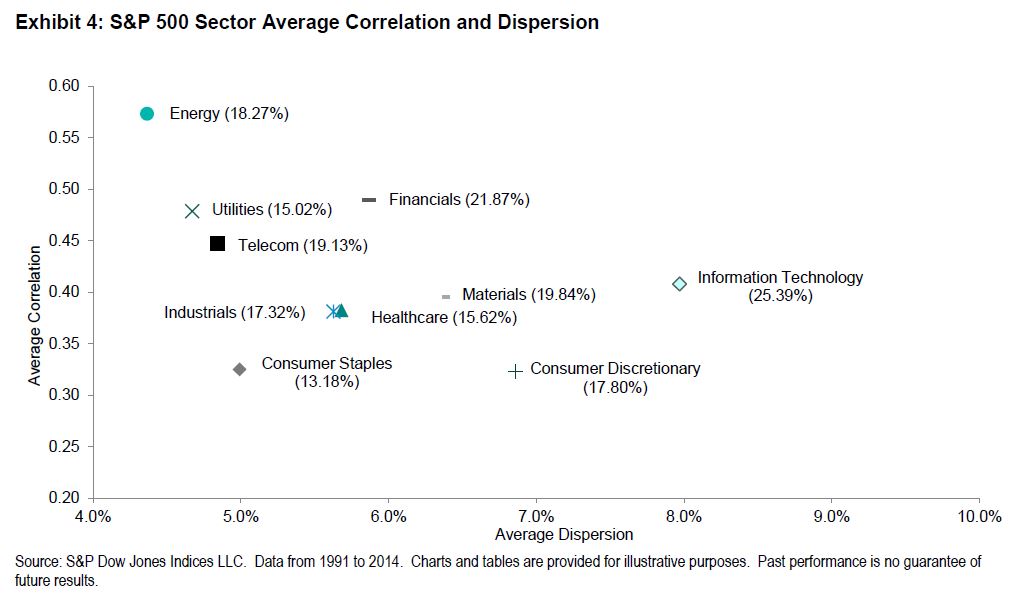 We immediately notice that the highest volatility sectors tend to be the farthest from the origin and the lowest volatility sectors the closest — confirming our intuition about the interaction of dispersion and correlation. But these data — ironically, perhaps, derived entirely from passive benchmarks — can also provide some useful guidance for active investors.
First, since dispersion measures the potential benefit of stock selection, an active stock picker might wish to concentrate his efforts on high-dispersion sectors. There is, e.g., more potential benefit to choosing among technology stocks than among energy companies or utilities. If analytic resources are scarce, in fact, there’s an argument to be made for simply indexing the low-dispersion sectors. (We know at least one major institutional investor which does exactly that.)
