If you experience your most expensive 4th of July ever, it may be from the unprecedented shortages of commodities in June. Since 1970, as far back as the S&P GSCI has data, there has never been a June with as many commodities in backwardation as in June 2014.
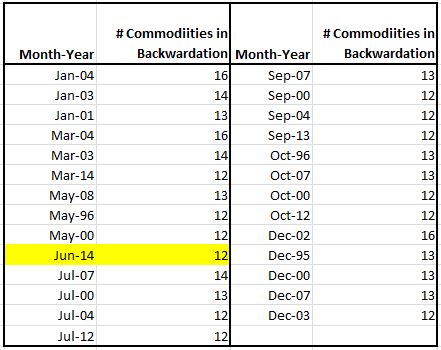
Of 24 commodities in the S&P GSCI, 23 of which are in the DJCI, 12 are in backwardation (as defined by the monthly excess return less the monthly spot return): Brent Crude, Cocoa, Copper, Corn, Cotton, WTI Crude Oil, Feeder Cattle, Gold, Live Cattle, Natural Gas, Soybeans and Unleaded Gasoline. 16 commodities are the most that were ever in backwardation together during any month in history. That happened 3 times: in March 2004, Jan 2004, and Dec 2002. Also, the last time there were more than 12 commodities in backwardation was before the global financial crisis, back in May 2008, when there were 13 commodities in backwardation.
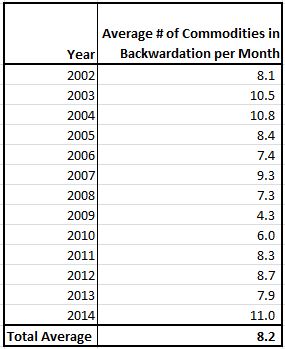
The average number of commodities in backwardation per month since 2002 when all 24 commodities were included in the index is 8. In 2014 through June, it has been 11 per month on average. We have not seen this since 2004 when the average was also 11 per month – the total return that year was 17.3%.
Last, notice in the chart below that going all the way back to 1970, there are some months that never saw 12 or more commodities in backwardation. Never has a Feb, Apr, Aug or Nov seen a count this high, and in 2014, June makes it’s first appearance in the list.