After the dramatic sell-off in gold, the question for both traders and investors is what to do now.
First off, SPDR Gold Shares (NYSEArca: GLD) and other bullion-backed ETFs need to find a a bottom and it appears that the low has not yet been reached.
It is possible that once a bottom is firmly established it may only be realized in hindsight. So until then trader and investor mentality looks to have shifted from buying the dips to selling the rallies.
Despite the technical evidence to suggest a maturing bull trend in GLD/Gold as early as September 2011, an extensive and rather large consolidation pattern began to unfold. Realistically, resolution to this pattern was needed to call for a continuation of its 2008 bull run or an end to it. On 4/12/13, to pick an exact date, the bull market in GLD/Gold ended.
The warning signs were there but confirmation of a top was still needed.
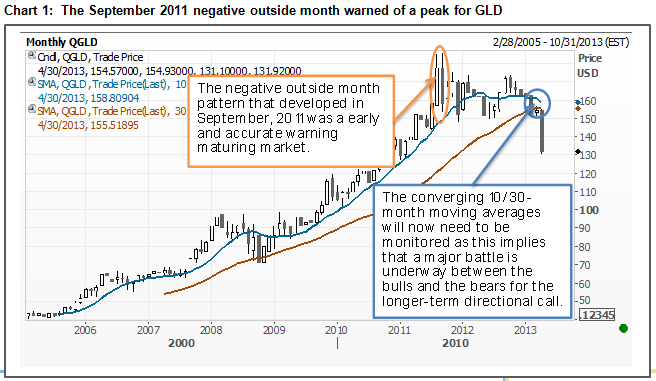
There were early warning signs that GLD was running into trouble as early as September 2011, the month that GLD reached all-time highs of 185.85. A powerful technical reversal pattern, known as a “negative outside month,” formed as many analysts were speculating much higher prices. The chart on the other hand was telling a different story as there were concerted distribution forces occurring to form this pattern.
Specifically, a negative outside month is a technical pattern which forms when the high of one period is above the high of the prior one, the low is lower than the prior period’s low, and the closing price is below its former close. Granted there are some variations to this pattern, but the takeaway is that it is a sign of distribution and the fact that it was a powerful monthly pattern and not a smaller daily or weekly pattern, eyebrows should have been raised. In hindsight, it is kind of interesting how a negative outside day pattern actually occurred on the day that GLD peaked.
Nineteen months were needed, but a top has been confirmed.
