
By Justin Sibears, Newfound Research
This post ended up being more timely than we could have ever imagined as Credit Suisse announced that it would accelerate XIV’s maturity after the ETN lost more than 90% of its value from Friday’s close.
We are leaving the post up for transparency and to highlight the importance of fully understanding the risk of any investment. We tried our best in the original post to clearly describe the downsides associated with using inverse volatility strategies. We have a saying at Newfound that “risk cannot be destroyed, only transformed.” Part of living with that statement in mind is being aware that (a) there are always risks associated with an investment and (b) just because you may not be able to spot the risk doesn’t mean they aren’t there. In fact, if you can’t spot the risk, you are probably better off staying away entirely.
Two other observations:
- I had CNBC on for most of the day today. Predictably, the talking heads were doing quite a bit of extrapolating. They used XIV’s failure as an opportunity to criticize ETPs generally. XIV behaved exactly as we would have expected given what went on in the market. XIV is designed to deliver inverse exposure to a weighted average of the front two months of VIX futures contracts. This is exactly what it did. The events of the last two days did not unearth some unknown risks of ETNs and it certainly should not cause any alarm for holders of plain vanilla ETFs like SPY.
- CNBC also placed plenty of blame on “leverage” generally. Leverage is just a tool. It isn’t inherently good or bad. Sure, when used irresponsibly, it can lead to disaster. However, when used prudently and in moderation it can be very useful, especially when used to move investors towards more risk efficient, diversified portfolios. Just two quick examples of this. First, the levered ETF portfolio we discussed, despite being leveraged, actually outperformed SPY due to the diversification provided by Treasuries. Second, the most well-known risk parity funds, most of which use leverage, also outperformed equities due to their superior diversification profile.
Summary
- We believe that capital efficiency should remain a paramount objective for investors.
- The prudent use of leverage can help investors employ more risk efficient portfolios without necessarily sacrificing potential returns.
- Many investors, however, do not have access to leverage (be it via borrowing or derivatives). They may, however, have access to leverage via the variety of ETFs and ETNs available in the market.
- We explore three ways that investors could do this using high beta ETFs, levered ETFs, and derivative ETNs.
- Each method comes with its own set of risks, but these options provide investors with practical ways to convert high risk-adjusted returns into higher absolute returns without borrowing money or using margin.
Over the last few months, we’ve been advocating strongly for capital efficiency as a way to deal with potentially muted returns in major asset classes over the next decade. In Portable Beta: Making the Most of the Returns You’re Already Getting[1], we laid out four ways that investors can achieve greater efficiency:
- Reduce fees to take home more of what you earn.
- Express active views more purely so that we are not caught paying active management prices for closet beta.
- Focus on risk management by “diversifying your diversifiers” with strategies like trend following that can help increase exposure to higher return asset classes without necessarily increasing the overall portfolio risk profile.
- Utilize modest leverage so that investors can create more risk-efficient portfolios without necessarily sacrificing potential return.
In Levered ETFs for the Long Run[2], we focused on the last approach: introducing modest leverage. Acknowledging that many investors do not have access to traditional tools for achieving leverage (e.g. margin, derivatives), we explored the common criticisms of levered ETFs and demonstrated how they may be used in the context of a portfolio to introduce diversifying exposure without necessarily sacrificing returns.
Continued innovation in exchange traded products means that in reality there are actually a number of ways that we can introduce leverage into a balanced portfolio without any direct borrowing. In this week’s commentary, we evaluate three approaches:
- High Beta ETFs
- Levered ETFs
- Derivative ETNs
We will describe each of these strategies in subsequent sections.
Our Benchmark
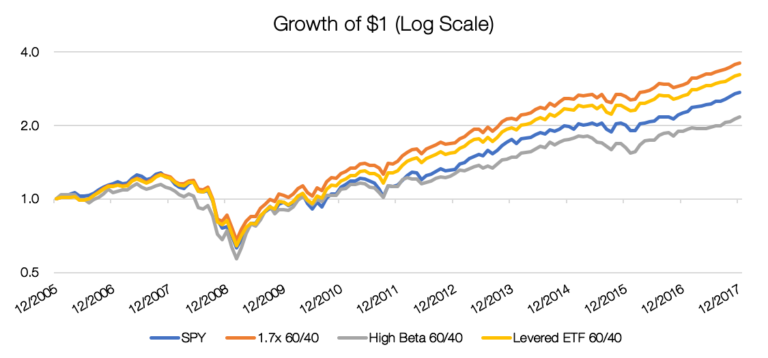
To evaluate each strategy, we will use a 1.7x levered 60/40 portfolio as the benchmark. The 60/40 portfolio consists of a 60% allocation to the SPDR S&P 500 ETF (ticker: SPY) and a 40% allocation to the iShares 7-10 Year Treasury ETF (ticker: IEF). We choose 1.7x leverage as, with the benefit of hindsight, this leads to equity-like volatility over the period studied. We consider daily, monthly, quarterly, and annual reset versions of this benchmark[3].
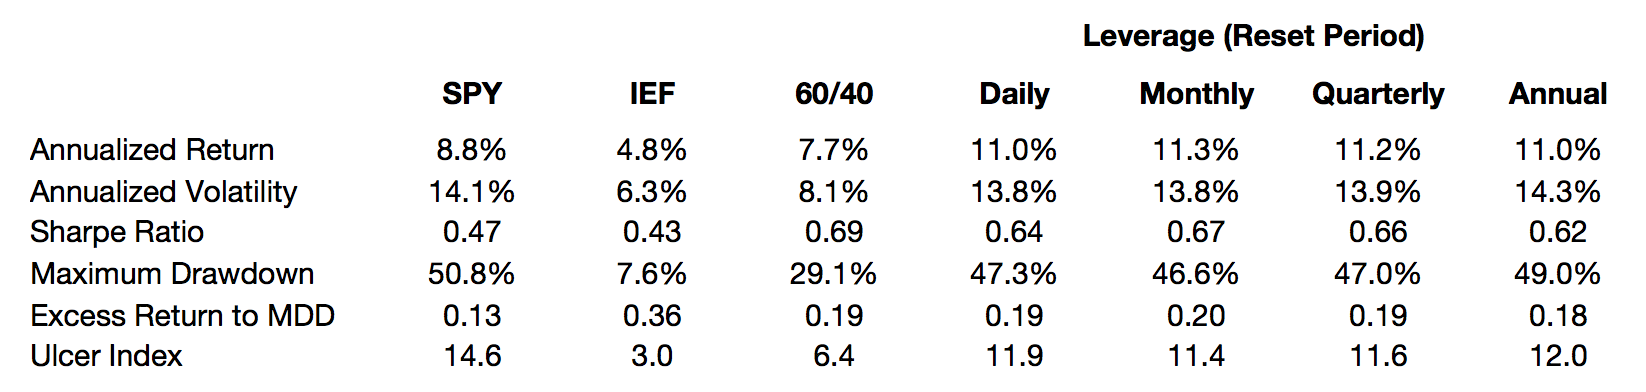
![]() We can see that the leverage reset frequency does not materially impact risk or return. Therefore, we will simply use the monthly reset version going forward in the interest of simplicity.
We can see that the leverage reset frequency does not materially impact risk or return. Therefore, we will simply use the monthly reset version going forward in the interest of simplicity.

Source: CSI, Bloomberg. Calculations by Newfound Research. Data covers the period from December 2005 to December 2017. Index returns are hypothetical and backtested. Fees for underlying exposures are netted out, but no other fees (advisor fees, trading costs, etc.) are accounted for. Returns include the reinvestment of dividends. The cost of leverage is applied daily assumed to be the 3-month Treasury Bill Rate plus a spread of 1.00%. Returns are not reflective of any strategy managed by Newfound. Past performance does not guarantee future results.
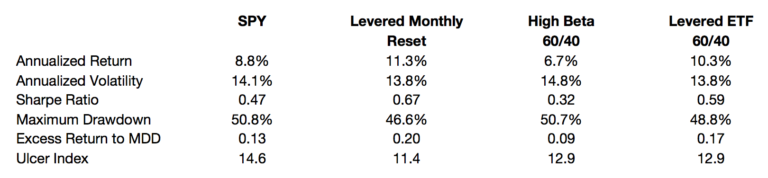
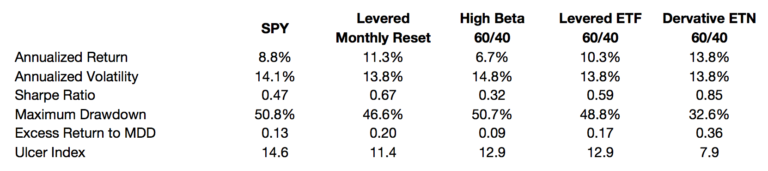
This strategy does not use any leverage or derivatives, but rather replaces SPY and IEF with higher beta stock and bond exposures. We replace SPY with the PowerShares S&P 500 High Beta ETF[4] (ticker: SPHB) and IEF with the iShares 20+ Year Treasury ETF (ticker: TLT). In other words, we move from market-cap weighted equities to equities with betas in the top 20% of the S&P 500 and from intermediate to high-duration bonds Treasuries.
This approach to introducing leverage is far inferior to actual leverage of the benchmark 60/40 portfolio.

Source: CSI, Bloomberg. Calculations by Newfound Research. Data covers the period from December 2005 to December 2017. Index returns are hypothetical and backtested. Fees for underlying exposures are netted out, but no other fees (advisor fees, trading costs, etc.) are accounted for. Returns include the reinvestment of dividends. The cost of leverage is applied daily assumed to be the 3-month Treasury Bill Rate plus a spread of 1.00%. Returns are not reflective of any strategy managed by Newfound. Past performance does not guarantee future results.
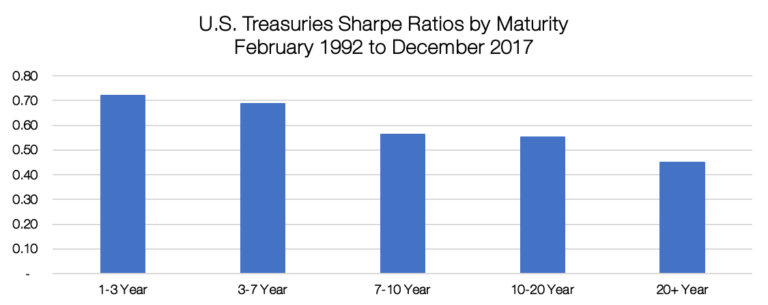
 These results should not be too surprising. After all, we are taking the wrong side of the well-documented low volatility factor. Decades of evidence suggest that lower beta stocks and lower duration bonds offer a superior risk-adjusted return profile relative to their higher volatility counterparts. The lower Sharpe ratios of higher beta securities creates a significant headwind. As we increase our beta, and with it our portfolio volatility, our expected return per unit of risk goes down. Therefore, while we are taking more risk, our actual compensation for it may not even exceed the expectation of a non-levered portfolio.
A 60/40 portfolio of a low volatility equity ETF and a lower duration bond ETF and levered up to the same volatility as the 1.7x 60/40 portfolio would likely generate higher returns.
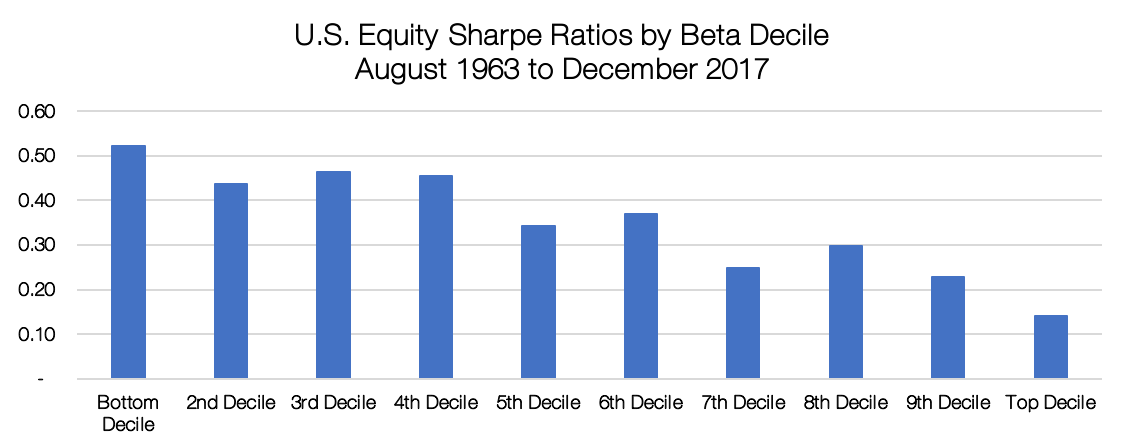
Source: Fama/French data library. Calculations by Newfound Research. Data covers the period from August 1963 to December 2017. Index returns are hypothetical and backtested. Returns are gross of all fees and expenses. Returns include the reinvestment of dividends. Returns are not reflective of any strategy managed by Newfound. Past performance does not guarantee future results.
Strategy #2: Levered ETFs
In this strategy, we replace SPY and IEF with 2x levered versions. As an example, this strategy could be implemented using the ProShares Ultra S&P 500 (ticker: SSO) and the ProShares Ultra 7-10 Year Treasury (ticker: UST). For this analysis, we replicated[5] SSO and UST since they did not launch until 2006 and 2010, respectively.
This effectively creates 2x levered exposure to a 60/40. As a result, it has significantly higher volatility than our 1.7x levered benchmark. To make our comparisons apples to apples, we blend the Levered ETF 60/40 with the unlevered 60/40 so that the overall portfolio volatility matches that of our benchmark.
Source: CSI, Bloomberg. Calculations by Newfound Research. Data covers the period from December 2005 to December 2017. Index returns are hypothetical and backtested. Fees for underlying exposures are netted out, but no other fees (advisor fees, trading costs, etc.) are accounted for. Returns include the reinvestment of dividends. The cost of leverage is applied daily assumed to be the 3-month Treasury Bill Rate plus a spread of 1.00%. Returns are not reflective of any strategy managed by Newfound. Past performance does not guarantee future results.
The Levered ETF portfolio actually does quite well relative to the benchmark. In fact, of the 104bps lag in annualized return, about half can be attributed to the higher management fees on SSO/UST relative to SPY/IEF.
Source: CSI, Bloomberg. Calculations by Newfound Research. Data covers the period from December 2005 to December 2017. Index returns are hypothetical and backtested. Fees for underlying exposures are netted out, but no other fees (advisor fees, trading costs, etc.) are accounted for. Returns include the reinvestment of dividends. The cost of leverage is applied daily assumed to be the 3-month Treasury Bill Rate plus a spread of 1.00%. Returns are not reflective of any strategy managed by Newfound. Past performance does not guarantee future results.
Strategy #3: Derivative ETNs
In this strategy, we replace SPY and IEF with ETNs that offer exposure to derivatives-based indices whose returns are correlated to those of traditional stocks and bonds.
On the equity side, we focus on inverse volatility strategies. Specifically, we will consider the index[6] tracked by the VelocityShares Daily Inverse VIX Short-Term ETN (ticker: XIV). XIV offers exposure to a rolling short position in VIX futures and is therefore “short volatility.”
The correlation between monthly excess returns for XIV’s underlying index and SPY is 0.77. The beta of the index to SPY is 3.4 and so it certainly offers a form of leveraged exposure to the equity market.

Source: CSI, Bloomberg. Calculations by Newfound Research. Data covers the period from December 2005 to December 2017. Index returns are hypothetical. Fees for underlying exposures are netted out, but no other fees (advisor fees, trading costs, etc.) are accounted for. Returns include the reinvestment of dividends. Past performance does not guarantee future results.
On the bond side, we use the Janus Velocity Short LIBOR Index. This index is tracked by the VelocityShares Short LIBOR ETN (ticker: DLBR), a new offering launched in August of last year. The index provides long exposure to the first 8[7] quarterly Eurodollar futures contracts.
Eurodollars are unsecured time deposits held outside of the U.S. (including by foreign branches of U.S. banks) and denominated in U.S. dollars. Even though these deposits are held outside of the U.S., they are still a key funding source for U.S. banks since banks can borrow offshore in the Eurodollar market and then transfer funds onshore. In fact, U.S. banks generally consider funding through Fed Funds and Eurodollars as close substitutes. LIBOR is the implied interest rate at which banks in London offer Eurodollars.
Eurodollar futures contracts are quoted as 100 minus LIBOR. As an example, if LIBOR for a particular maturity is at 1.25%, the contract will be quoted at 98.75. As such, being long Eurodollar futures is equivalent to being short LIBOR (i.e. we profit when rates go down), just like standard bond positions.
The specific number of Eurodollar futures contracts held is calculated such that the index delivers a return equal to the weighted average percentage change in LIBOR across the maturities held. Note that we can think about this as if we have exposure to the 1-Year Spot LIBOR index.
As an example, if rates fall 25bps from 5.00% to 4.75%, the index will return approximately 5.00% (0.25% / 5.00%). When rates are lower (higher), the impact of the same 25bps move will be higher (lower). A 25bs decrease with rates starting at 10.00% will produce a gain of 2.50%. A 25bps decrease with rates starting at 2.50% will produce a gain of 10.00%.
This payoff structure creates issues when rates are low. To mitigate this, the index linearly reduces its exposure to rate moves below 2.50%; the exposure is 100% when the 1-year spot LIBOR index is at 2.50% and 0% when the 1-year spot LIBOR is at 0.00%.
The following table illustrates the gain/loss realized from a +/- 25bps move at various starting rate levels.

In the backtest, the index boasts a 0.71 correlation to IEF and 2.9 beta to IEF, suggesting potential usefulness as levered bond exposure.
One important thing to keep in mind with DLBR is that because of how its payoff is structured relative to LIBOR, its volatility profile could change materially depending on LIBOR’s level. Assuming that LIBOR volatility was constant over time, we would expect DLBR’s volatility to be relatively lower when LIBOR was below 2.5% (where the participation rate is reduced), highest when LIBOR is just above 2.5%, and then declining as LIBOR rises. In reality, rate volatility is not constant, but nevertheless the pattern still roughly holds when we approximate returns by applying the payoff formula to historical 1-year LIBOR[8].

Source: CSI, Bloomberg. Calculations by Newfound Research. Data covers the period from December 2005 to December 2017. Index returns are hypothetical. Fees for underlying exposures are netted out, but no other fees (advisor fees, trading costs, etc.) are accounted for. Returns include the reinvestment of dividends. Past performance does not guarantee future results.
A 60/40 blend of the indices tracked by XIV and DLBR delivers very strong risk-adjusted returns, albeit with nearly 3x more volatility than SPY (40.9% annualized volatility vs. 14.5% for SPY). As we did with the Levered ETF strategy, we blend the XIV/DLBR portfolio with the unlevered SPY/IEF 60/40 in a proportion that has the same volatility as SPY. Note that we do this with the benefit of hindsight. In reality, we would have to estimate future volatility. However, we use this approach for easier performance comparisons. The Derivative 60/40 delivers 2.6% more annualized return than the benchmark and a nearly 30% reduction in drawdown.
Source: CSI, Bloomberg. Calculations by Newfound Research. Data covers the period from December 2005 to December 2017. Index returns are hypothetical. Fees for underlying exposures are netted out, but no other fees (advisor fees, trading costs, etc.) are accounted for. Returns include the reinvestment of dividends. Past performance does not guarantee future results.

Source: CSI, Bloomberg. Calculations by Newfound Research. Data covers the period from December 2005 to December 2017. Index returns are hypothetical. Fees for underlying exposures are netted out, but no other fees (advisor fees, trading costs, etc.) are accounted for. Returns include the reinvestment of dividends. Past performance does not guarantee future results.
Of course, this type of reward doesn’t come without any additional risk. In this case, the main risk is summed up nicely from this line in XIV’s prospectus[9]:
“The long term expected value of your ETNs is zero. If you hold your ETNs as a long-term investment, it is likely that you will lose all or a substantial portion of your investment.”
