By Cade Irwin and Derek Horstmeyer
Buffered ETFs have come onto the scene in the last four years, promising near equity returns while minimizing downside exposure. These new ETFs are constructed to track an index but also to minimize downside volatility through the use of collar options, providing as much as 30% downside protection.
While these are very innovative products, we decided to investigate how exactly have these new ETFs have fared over the past few years. Interestingly, although they have not kept up with their benchmarks on a pure return basis, on a risk-adjusted basis which incorporates their systematic risk (Treynor Ratio), it does look like buffered ETFs are matching their benchmark performance.
For our analysis, we collected all buffered ETFs that are currently trading and tracked their returns going back to 2018 (when the first one was launched). We then matched each buffered ETF to the benchmark that it was following and separated them by sub-class: large-cap, small-cap, growth equity, and emerging market.
In order to better understand buffered ETFs and compare them to their designated benchmarks, we evaluated the impact of reduced volatility. As evident by the averages of buffered ETFs and their benchmarks, there was not as high of a return in the buffered ETFs — the average benchmark delivered an annualized return of 23% over the past four years while the average buffered ETF delivered 8%. This was to be expected, as there is an upside cap on the buffered ETFs.
| Return (%) | Sharpe | Treynor | Volatility (%) | Average Annual Expense Ratio. (%) | ||
| Buffered ETF | 8.38 | 0.2914 | 0.1433 | 9.4062 | 0.803 | |
| Benchmark | 23.19 | 0.3901 | 0.1398 | 17.8896 | 0.181 |
Next, we looked at the risk-adjusted returns to each grouping. First, the average benchmark had a Sharpe ratio of 0.39 while the average buffered ETF had a Sharpe ratio of 0.29. Turning to the average Treynor ratios, we see that the average buffered ETF had a slightly higher ratio (0.14) than its benchmark (0.13).
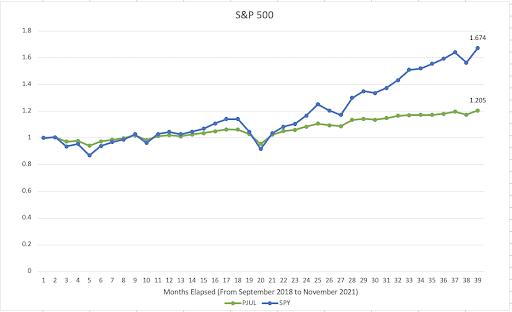
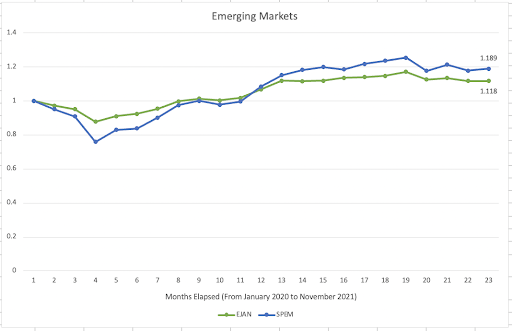
To graphically represent the reduction in volatility that a buffered ETF provides, below are two graphs. The first shows the returns to a buffered ETF tracking the S&P 500 against the returns to the SPY. The second shows the returns to an emerging markets buffered ETF against an emerging markets ETF.
If a risk-averse investor is looking for exposure to a particular index but wants half the volatility and half the systematic risk, then a buffered ETF may be the way to go for them. With the Fed signaling a faster tapering of asset purchases in 2022 and a new strain of COVID coming into play, volatility may be back on for markets in the new year. If this is the case, a buffered ETF may help with a reduction in risk along this bumpy path while still giving exposure to equities.
For more news, information, and strategy, visit ETF Trends.
