

By Confluence Asset Management
Previously, we discussed the impact of reducing the size of the Federal Reserve’s balance sheet on the economy. This week we will discuss the effects of QE on financial markets.
The relationship between the balance sheet and equities seems rather straightforward; expanding the balance sheet appears to be clearly supportive for equities.
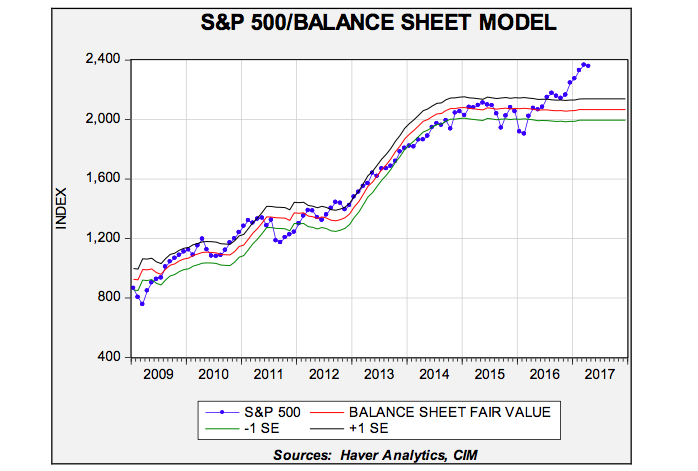
This chart shows the S&P 500 Index regressed against the Fed’s balance sheet. From 2009 until last year, this equity index closely tracked the level of the balance sheet. Equities have lifted above the forecast level of the balance sheet recently. If the relationship holds, equities are vulnerable to a large decline. On the other hand, there is no evidence to suggest that bank reserves somehow found their way into the equity market. Comparing the Shiller P/E (CAPE) suggests that the effect of QE was probably psychological; after fed funds reached the zero bound, QE signaled to investors that policy was still easy.
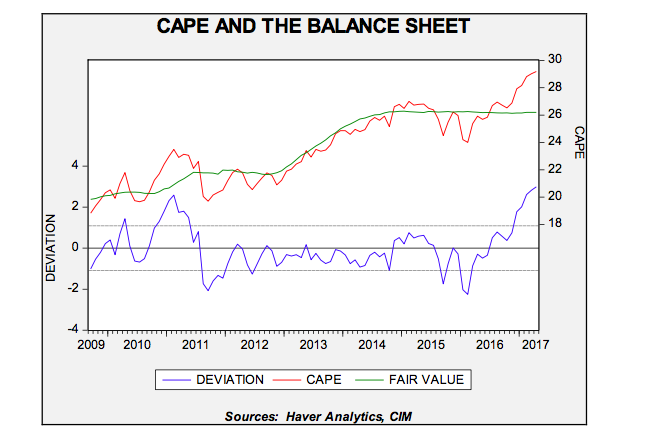
This chart regresses the CAPE against the Fed’s balance sheet; the CAPE’s behavior is similar to that of the overall equity market. After the election, the market has mostly risen on multiple expansion, rising well above the model’s fair value.
It should be noted that low interest rates could have a similar effect. However, the fact that equities and the P/E seemed to track the balance sheet does suggest that QE had an impact on market psychology.