
By Ryan Gilmer, TOPS ETF Portfolios
International investing has gone through several developments as assets have grown over time. At one point, holding international investments was an odd thing. Today, any well diversified portfolio should have a significant allocation to international investments. Even though the use of international investments has been gradual over many years and the practice is now well accepted, many investors still struggle to understand important nuances of investing internationally.
Possibility the most misunderstand aspect of investing internationally is the impact currency changes can have on investment returns. Many investors are disenchanted with their international holdings as they have underperformed US stocks over the past five years. However, much of the performance over the past 5 years can be attributed to the strong U.S. Dollar.
Experienced global investors should recognize international equities and currencies will cyclical over time, and there is good reason to believe that they will come back into favor sometime soon. In fact, year to date, we have started to see this change. Returns for both developed and emerging markets indexes are largely ahead of U.S. stock indexes in 2017.
Trends will Change over Time
While is easy to focus on the most recent trend of U.S. outperformance, it is more helpful to look over a longer period, encompassing multiple market cycles. The following chart looks at relative returns from 1999.
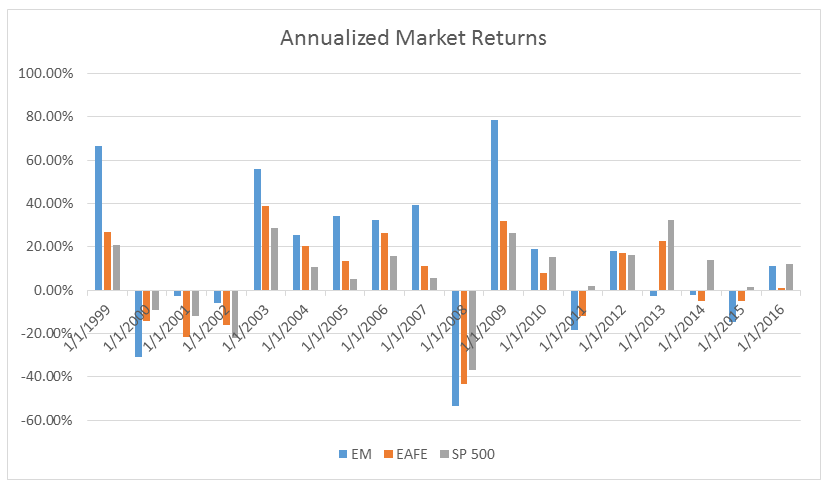
Data provided by Bloomberg
The graph shows annualized stock market performance for emerging markets (FTSE Emerging Markets All Cap China Inclusion index), developed international stocks (FTSE All-World ex US index), and US stocks (S&P 500) from 1999-2016. The Vanguard FTSE Emerging Markets (VWO) tracks the emerging market index, while Vanguard FTSE All-World ex-US (VEU) tracks international stocks. The iShares Core S&P 500 (IVV) tracks domestic names.
Both emerging markets and developed international markets outperformed US equities for every calendar year from 2003 – 2007. Much of this was fueled by a significant period of dollar weakness. Conversely, US stocks outperformed for five of the last six years, a period of dollar strength. This outperformance has been well documented, tempting many to abandon international exposure.
We believe, at some point, international currencies will strengthen against the dollar leading to international equity outperformance. So far in 2017, this has been the case, yet it is too early for us to claim the cycle has shifted.
Currency Cycles over Time
An important factor in how international investments fare relative to US is the value of the dollar. The following graph shows the US dollar trade weighted index over a 30-year period, from 1987 to present day. The graph shows how the dollar has performed relative to basket of currencies including the Japanese yen, the euro, the British pound, the Canadian dollar, and the Mexican peso, among others.
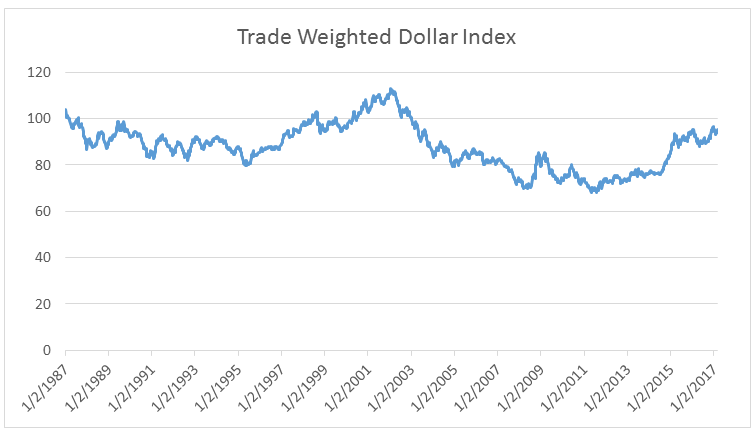
Data provided by Bloomberg
Some observations from the graph include:
- The peak of dollar strength occurred in 2002, while the trough of dollar weakness occurred during the financial crisis of 2008
- The index traded in a range between 80-100 for 12 years between 1987-1999, but from 2002-present, the range has expanded to roughly 70-100
- The last time the dollar was this strong was May of 2003 (almost 14 years)
The following graph looks at the data another way. The blue line shows a ten-year rolling percentile ranking for dollar strength, with 100% being the strongest and 0% being the weakest. Said another way, it takes the dollar index and compares it to all the values over the prior ten-year period, and assigns a ranking of 0-100. The orange line does the same thing, but with a twenty-year period.
