
By Rod Smyth, RiverFront Investment Group
There is rarely a shortage of things to worry about and an old adage that “a bull market climbs a wall of worry.”
The headlines have moved from the French election to North Korea. We don’t believe anyone can handicap the probability of a nuclear conflict with North Korea, but we would note that, as a market indicator, South Korean stocks are up about 16% year-to-date and over 30% from their bear market lows in early 2016 (as measured by the MSCI Korea 25/50 Index).
Clearly investors in South Korea have judged that war is not imminent, and we agree.
Rather, it looks to us as if the major players are setting the stage for a potential negotiation, which will be challenging. One major positive of the heightened tensions in North Korea has been the recognition by the administration of the importance of China as a strategic partner as well as a trade partner/competitor. As investors, we believe that neither side would benefit from a trade war.
Every month or so, someone sends us an article written by someone who believes US stocks are significantly over valued and warns of the dangers of owning them. Value is a difficult and subjective issue for investors to agree on, even at extremes. Our Price Matters® methodology suggests that large cap US stocks are 7.5% above trend as of March 31st.
Our central argument is that while US stock valuations are currently above average, they are not at extremes. They are, however, high enough that we believe the next recession is likely to cause both earnings and valuations to decline, resulting in an unpleasant bear market. We remain optimistic on US stocks as we don’t yet see the conditions for recession.
Simple measures of price-to-earnings (PE) can be misleading. If earnings are cyclically depressed, stocks can look “expensive” even after significant price declines, and can look artificially “cheap” when earnings are cyclically extended.
For this reason, we have found it useful to adjust earnings for the business cycle. One way to do this is to take an average of the last 10 years of earnings. This is helpful, but can be distorted by major spikes and troughs when they roll out of the numbers.
For example, the 10-year average of US earnings will rise dramatically as the 2008/9 numbers fall out, unless we experience a similar decline in the next couple of years. Because of this limitation, we prefer to look at the long-term trend of earnings, shown below, which has remained constant at around 6% for the last 80 years.
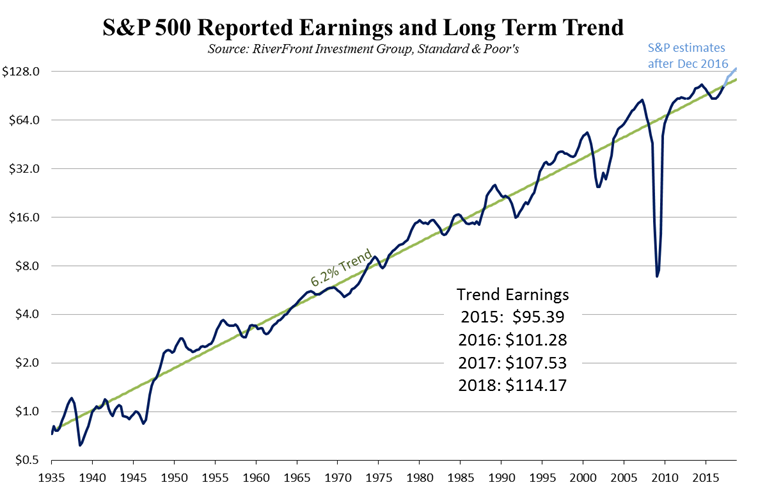
Source: RiverFront Investment Group, Standard & Poor’s. Past performance is no guarantee of future results.
In the chart on the previous page, the numbers under the earnings line show the level of trend earnings for year end 2015 – 2018. Actual reported earnings recently cycled slightly below trend and finished 2016 right on the trend. S&P estimates that they will rise above trend again over the next two years. If we use trend earnings to value stocks, then we can take out the year-to-year fluctuations. In our view, this makes it easier to see valuation extremes.
In hindsight, just like our Price Matters® work, it highlighted the extreme overvaluation of the late 1990s and the corresponding undervaluation in early 2009. This is shown in the chart below. The parallel lines are different PE multiples of the trend line shown in the previous chart. We make one adjustment: since stock investors typically look ahead, we use the one year forward number. Thus, the trend lines shown below also rise at 6.2%.
By this valuation measure, large cap stocks are at post ‘08 highs but below historic peaks.
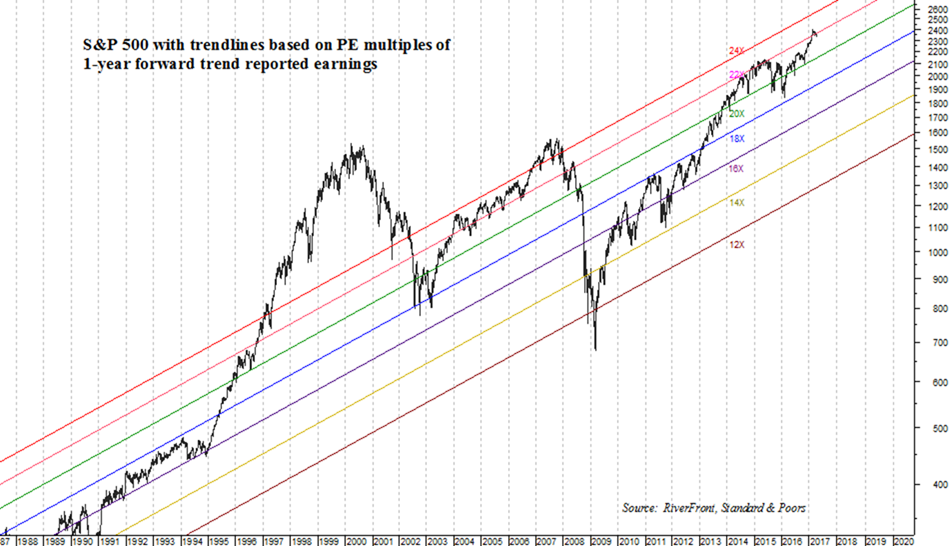
Source: RiverFront Investment Group, Standard & Poor’s. Past performance is no guarantee of future results.
What we see in the chart above are regimes that hold for a while and then dramatic changes in the regime, especially around recessions that produce earnings declines. Following recessions, when investors are reminded that earnings are cyclical, confidence gradually returns. 18x (the blue line) was a ceiling from 1990–1995, a floor in 2002 and a ceiling again from 2010 to 2012. From 2004 to 2007, there was a tight range between 22x and 24x, and recently 22x (the current level) has acted as a ceiling. We believe regimes of very low interest rates that are accompanied by growing earnings will tend to lead to higher valuations as investors compare the dividends and growth potential of stocks against the low bar of cash and bond yields.
Conclusion: We do not see valuation as a constraint on higher prices, provided earnings continue to grow, which we think will happen. However, we need to recognize that the next recession will likely involve a period of both lower earnings and lower valuations. This is not the time to be overly concentrated in US stocks, in our view.
