
By Tim Anderson, RiverFront Investment Group
The domestic reflation trade that began in earnest after the November election resulted in record high US equity prices, high yield bond outperformance, and higher interest rates. However, the reflation trade has now hit a speed bump, due to President Trump’s inability to garner enough votes to deliver on his campaign promise to replace the Affordable Care Act last month.
This failure has now called into question his ability to deliver on some of his more market friendly promises, such as income tax reform and infrastructure spending. Since the election, the S&P 500 is up about 11%, the high yield market is up almost 4% and the 10-year Treasury yield is about 0.55% higher, although all three have drifted lower over the past few weeks, as political reality set in. This week, we will take a closer look at the more recent trends in the high yield sector and US interest rates, why we think the previous trends may have stalled out, and examine where we go from here.
High Yield Market
The high yield market got off to a solid start this year, continuing its strong yearlong run (up 27.5% between 2/11/2016-2/28/2017). However, the momentum stalled out at the end of February for what we believe is a variety of reasons. The high yield market was up almost 3% through the end of February, but month-to-date (through 3/24/2017) the index is down over 1%. The economic fundamentals remain supportive for high yield, especially if the political agenda regains traction, but we remain cautious in the near-term for the following reasons.
Valuation: Yields and risk premiums have contracted sharply since 2/11/2016, when they had ballooned out to 10% (see chart below) and 877 basis points (bps), respectively. Yields and spreads hit near-term lows in early March at 5.6% and 355 bps, respectively. Since the end of February however, yields and spreads have backed up to 6% and 407 bps, which is still well below their long-term averages of 9% and 578 bps but well above their all-time lows of 4.85% (6/23/2014) and 241 bps (6/1/2007). As our Price Matters® framework has indicated that valuation in the sector has become increasingly less attractive, we have reduced our exposure accordingly. However, we could tactically increase our exposure again if there is a more pronounced selloff and valuations improve.
CHART 1: SHARP DROP IN YIELD MAKES THE HIGH YIELD MARKET LESS ATTRACTIVE, IN OUR VIEW
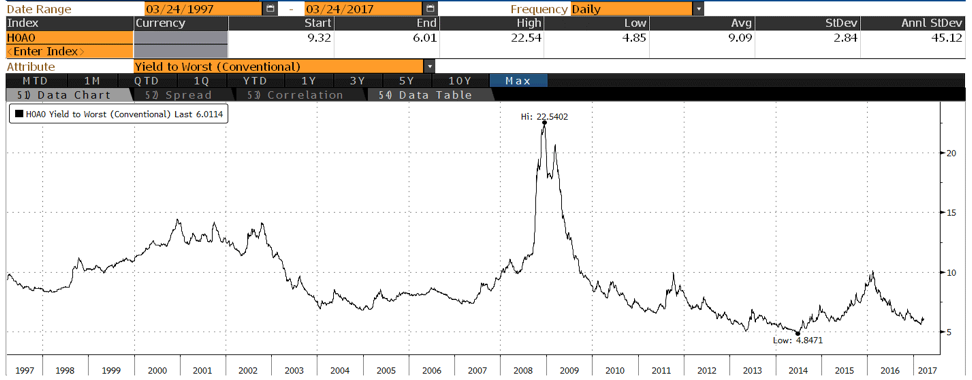
Source: Bloomberg, RiverFront Investment Group. Past performance is no guarantee of future results. The BofA Merrill Lynch US High Yield Index (H0A0) tracks the performance of US dollar-denominated below investment grade corporate debt publicly issued in the US domestic market. It is not possible to invest directly in an index. Data as of 3/24/2017.
Outflows: High yield ETFs and mutual funds have seen substantial outflows over the past few weeks, putting pressure on outstanding high yield bond prices. According to a March 23rd report from Wells Fargo Securities, high yield fund flows saw another $952 million in outflows over the past week (ending 3/22/2017). It was the third straight weekly outflow (totaling $8.6 billion). One bright spot was the rebound in high yield ETF flows over the past week (+$713 million).
Oil: The recent drop in oil prices from $54 at the end of February to $47 (-13%) has negatively affected the performance of the high yield energy sector. This, in turn, has dragged down the overall high yield market, as energy is still the largest sector (15-17%) in most high yield indices. The high yield market was up about 3% through 2/28/2017, but it has given back approximately 1% month-to-date (through 3/24/2017) while the energy sector is down 2% MTD, We believe that the high yield market had become comfortable with oil prices around $50, but it is likely to become increasingly volatile as they move closer to $40.
Interest Rates
The chart below shows that the 10-Year Treasury yield has risen about 1% since 7/8/2016, with about half of that increase coming since the 11/8/2016 election. We believe the post-election jump was due in part to the proposed fiscal stimulus plans being promised by the new President. Since the end of November however, the market has adopted more of a “show-me-the- money” attitude, with yields trading in a fairly tight range of about 2.3% to 2.6%.The big question now is whether the yield breaks out to the upside or downside.
Higher or Lower: We believe that ultimately the yield will break out higher, with the impetus likely to be some positive political progress on income tax reform and/or infrastructure spending. However, with the current political gridlock we would not be surprised to test the lower end of the range, but we believe the Treasury yield will likely end the year somewhere between 2.75% and 3%.
The Fed: Somewhat surprisingly, interest rates have fallen significantly since the Federal Reserve hiked interest rates on 3/15/2017, the third time during this rate hike cycle which started on 12/16/2015. The reported justification for rates falling sharply was that the Fed was just slightly more dovish than the market in their projections for future rate hikes. However, we believe the rally in rates was intensified by a record short position in 10-year Treasury futures before the last Fed meeting. We believe that the Fed is likely to hike rates at least two more times this year, depending on the success of passing the pro-growth policies, with the next hike likely to be at the 6/14/2017 or 7/26/2017 meeting.
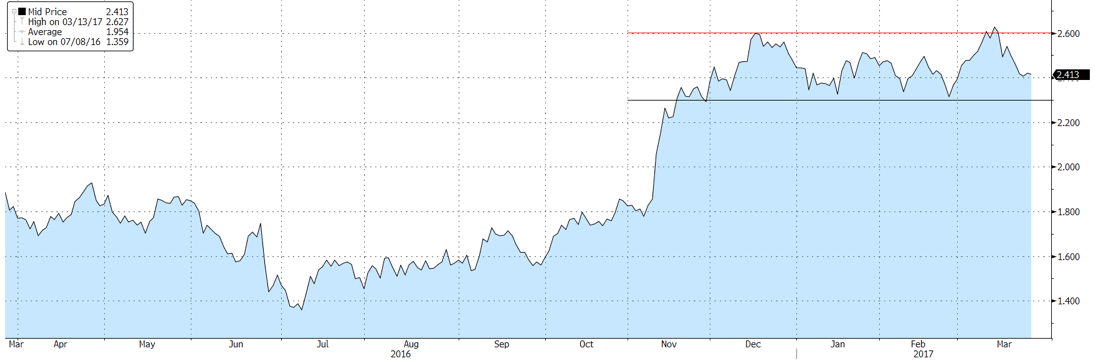
Source: Bloomberg, RiverFront Investment Group. Past performance is no guarantee of future results. Data as of 3/24/2017.
This articles was written by Tim Anderson, CFA, Chief Fixed Income Officer at RiverFront Investment Group, a participant in the ETF Strategist Channel.
