
– FTEC: Fidelity MSCI Information Technology
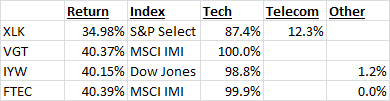
Here is a return table, with index provider and GICS sectors noted (data from Bloomberg as of 2/11/16):
While most of these ETFs returned in excess of 40%, XLK was significantly lower at 35%. One major reason for this discrepancy is based in the index provider. XLK lumps the smaller Telecom sector in with pure Technology. As noted in the above table, Telecom has the lowest return of all the GICS sectors, and as such had XLK with a performance drag versus the other more pure Tech offerings.
Another difference based on index is how far down the cap structure the index goes. As noted above, two of the ETFs use the MSCI IMI (Investable Market), so they will include mid- and small-cap issuers. Here is a table of the cap weightings, again as of 2/11/16.
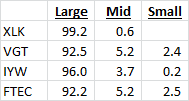 Those ETFs that have exposure down the cap structure benefitted over the past year, and smaller cap tech names outperformed their large cap counterparts. The S&P 400 Tech sector returned 49.40% and the S&P 600 Tech sector returned 57.01% (versus 38.11% for the S&P 500 Tech sector). This was another cause of some dispersion.
A second source of dispersion will be the underlying industry group exposure within the tech sector. Both the weight to a group and the return of said group will be different based on the index provider. Here is an attribution breakdown:

The clear leader in terms of industry group exposure was Semiconductors with over a 60% return. Of these ETFs, IYW had a higher weighting comparatively, which helped buoy its performance relative to the other names.
So where does that leave us now? Thus far in February, the Technology sector continues to rip higher. Depending on your view, there are numerous different ETF vehicles to play the Technology trade. Whether it is moving down the cap structure, using a factor-approach, delving into more focused industry exposure, or moving to more of a global versus US focus, there is most likely an ETF available to fine-tune your portfolio.
Clayton Fresk is a Portfolio Manager at Stadion Money Management, a participant in the ETF Strategist Channel.
Disclosure Information
Past performance is no guarantee of future results. Investments are subject to risk and any investment strategy may lose money. The investment strategies presented are not appropriate for every investor and financial advisors should review the terms and conditions and risks involved. Some information contained herein was prepared by or obtained from sources that Stadion believes to be reliable. There is no assurance that any of the target prices or other forward-looking statements mentioned will be attained. Any market prices are only indications of market values and are subject to change. Any references to specific securities or market indexes are for informational purposes only. They are not intended as specific investment advice and should not be relied on for making investment decisions. The Dow Jones Industrial Average is a price-weighted average of 30 significant stocks traded on the New York Stock Exchange and the NASDAQ. The S&P 500 Index is the Standard & Poor’s Composite Index of 500 stocks and is a widely recognized, unmanaged index of common stock prices. The MSCI Investable Market Indexes (IMI) cover all investable large-, mid- and small-cap securities across the Developed, Emerging and Frontier Markets, targeting approximately 99% of each market’s free-float adjusted market capitalization. One cannot invest directly in indexes, which are unmanaged and do not incur fees or charges. At the time of writing, Stadion held long positions in the SPDR Technology Select Sector (XLK) ETF. Founded in 1993, Stadion Money Management is a privately owned money management firm based near Athens, Georgia. Via its unique approach and suite of nontraditional strategies with a defensive bias, Stadion seeks to help investors—through advisors or retirement plans—protect and grow their “serious money.” Contact Stadion at 800-222-7636 or www.stadionmoney.com. SMM-022017-228
