Most Americans invest in mutual funds because they are seeking to grow their money. However, most investors also believe that an active manager will sell stocks to protect their investment when markets enter periods of failure. Unfortunately, this is often the furthest thing from the truth.
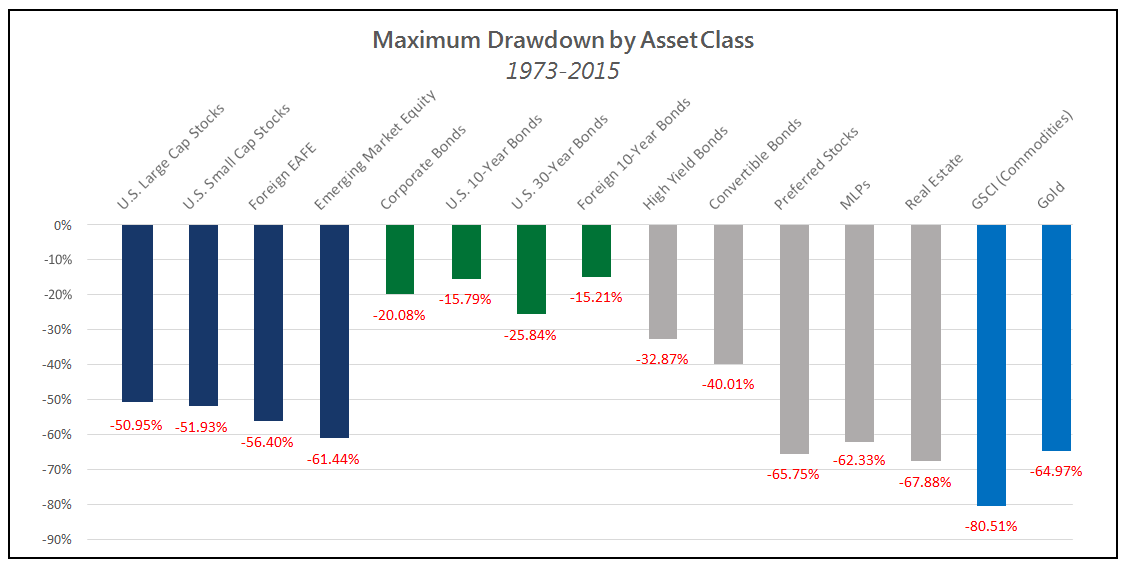
To start, let’s establish that all markets undergo periods of failure, often called bear markets. Looking at the chart below, it’s clear these failures can be devastating to a portfolio. The mathematical reality of returns supports this: the larger a loss a portfolio sustains, the harder the remaining capital has to work just to break even.
But what about the typical actively managed fund? Most funds’ objective is to beat their index each year. Most managers fail. Worse yet, most active managers don’t, or are not allowed to, act like their investors want them to. So what does a typical investor want? The dual mandate of growth in normal times with a solid effort to reduce losses in times of market failure. What does the investor typically get? Growth in the normal times but little to no loss mitigation during bear markets. Why?
One reason is that fund managers can not stray too far from their benchmark or they will lose their institutional mandate(s). This is an important distinction…individuals and institutions have different expectations. Neither are right or wrong, but institutions typically judge managers in relative terms versus the benchmark. In other words, institutions expect managers to follow their index closely even if it means going over the proverbial lemming cliff. Managers then often claim how great their performance was because they “outperformed”. Meanwhile, as an example, they could have beaten their benchmark’s performance by 1% and still lost 37% in 2008. To institutions, this is out-performance. To an individual who just lost 37%, it is a disaster.
Another reason active management can let investors down can be found in the fund’s offering prospectus. Even though many prospectuses have been modified after the 2007-09 bear market, many active funds effectively prohibit selling a large percentage of the portfolio. The fund’s managers are required to stay fully or mostly invested because this is what their prospectuses say or what management dictates.
Therefore, these managers are prohibited from doing what their individual investors expect them to do…limit the large losses found in bear markets.
Let’s not forget that index funds, by design, will follow their index closely even if it is plummeting like most stock indexes did in 2000-2002 and 2007-2009. Passive investing, seemingly all the rage, is great until human emotion overwhelms the typical investor during a significant drawdown. In other words, most active and passive management still forces the buy/sell decision back onto the client or, if the client is lucky, their advisors.
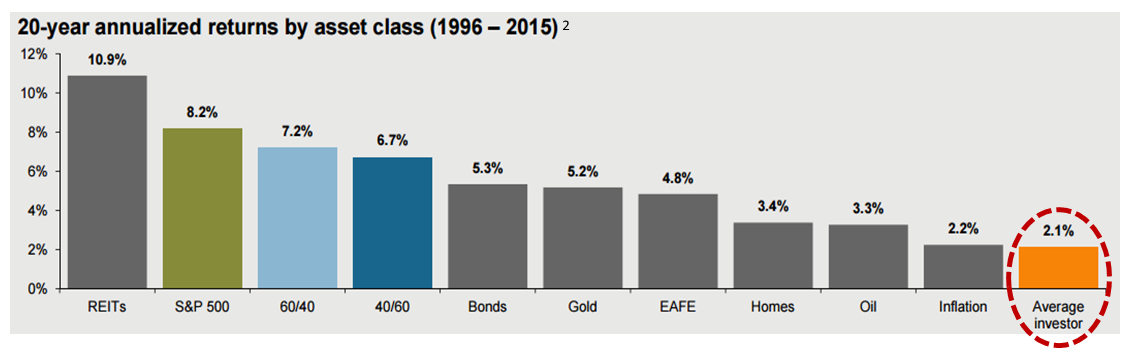
As the chart below illustrates, investors have a history of selling low and buying high relative to the benchmark performance. We let emotions overtake our decision-making process and the results are clear: Investors, as a group, cannot handle the volatility and devastating large losses. They actually want their money to be managed in all market conditions and do not want to, and should not have to, make the buy/sell decisions.
Tactical management was created to meet the typical investor’s needs and expectations. While still considered active, tactical management is quite different. Tactical management seeks growth during “normal” times but is engineered to avoid the majority of the losses found in a bear market. Put simply, tactical managers, most often following rules-based systems, do the buying AND selling for you.
No strategy can avoid all the losses, but as the data above illustrates, the losses found in bear markets typically take years to unfold. It is time to recognize that our industry needs to provide investors options that remove emotion, smooth the ride, and provide investors the opportunity to stay invested throughout the full market cycle by not subjecting them to large, devastating losses.
David Haviland is a Managing Partner and Portfolio Manager at Beaumont Capital Partners, a participant in the ETF Strategist Channel.
Disclosures
Copyright © 2016 Beaumont Financial Partners, LLC. All rights reserved. All materials appearing in this presentation are protected by copyright as a collective work or compilation under U.S. copyright laws and are the property of Beaumont Capital Management. You may not copy, reproduce, publish, use, create derivative works, transmit, sell or in any way exploit any content, in whole or in part, in this presentation without express permission from Beaumont Capital Management.
This material is provided for informational purposes only and does not in any sense constitute a solicitation or offer for the purchase or sale of securities nor does it constitute investment advice for any person.
The views and opinions expressed throughout this paper are those of our Portfolio Manager as of December 22, 2016. The opinions and outlooks may change over time with changing market conditions or other relevant variables.
The information presented in this paper is based on data obtained from third party sources. Although it is believed to be accurate, no representation or warranty is made as to its accuracy or completeness.
Past performance is no guarantee of future results. Diversification does not ensure a profit or guarantee against a loss. As with all investments, there are associated inherent risks.
An investment cannot be made directly in an index. Beaumont Financial Partners, LLC DBA Beaumont Capital Management – 250 1st Avenue, Suite 101, Needham, MA 02494 – (844) 401 -7699 salessupport@investBCM.com.
1 Chart source: Source: Global Asset Allocation (Chapter 3) via mebfaber.com, Meb Faber, March 6, 2015. Bloomberg for the period 1973-2015. The data shown for Convertible Bonds, Preferred stock, High Yield Bonds and MLPs is sourced by Bloomberg. They use the same end date as the rest of the asset classes (12/31/15), but have different starting dates due to the fact the indices for these asset classes did not exist in 1973. Convertible bonds is for the time period starting on 6/17/1986, Preferred stock data starts 9/9/2003 and the MLP data begins 12/21/1995. The returns shown are “Nominal Returns” for the time period specified. For more information on what each asset class performance is represented by, please reference the disclosure pages. “EAFE” represents the regions of Europe, Australasia and Far East. Asset class performance is represented by the following: U.S. Large Cap – S&P 500; U.S. Small Cap – French Fama Small Cap; Foreign Developed – MSCI EAFE; Foreign Emerging – MSCI EEM; Corporate Bonds – Dow Jones Corporate; T-Bills – U.S. Bills; 10 Year Bonds – U.S. 10-year bonds; 30 Year Bonds – U.S. 30-year bonds; 10 Year Foreign Bonds – Foreign 10-year bonds; High Yield – iBoxx Liquid High Yield; Convertible Bonds – Vanguard Convertible Securities Fund; Preferred Stocks – S&P Preferred Stock; MLPs – Alerian MLP; REITs – NAREIT; Commodities – GSCI; Gold – GFD.
2 Source: J.P. Morgan Asset Management; (Top) Barclays, FactSet, Standard & Poor’s; (Bottom) Dalbar Inc.
Indexes used are as follows: REITS: NAREIT Equity REIT Index, EAFE: MSCI EAFE, Oil: WTI Index, Bonds: Barclays U.S. Aggregate Index, Homes: median sale price of existing single-family homes, Gold: USD/troy oz, Inflation: CPI. 60/40: A balanced portfolio with 60% invested in S&P 500 Index and 40% invested in high quality U.S. fixed income, represented by the Barclays U.S. Aggregate Index. The portfolio is rebalanced annually. Average asset allocation investor return is based on an analysis by Dalbar Inc., which utilizes the net of aggregate mutual fund sales, redemptions and exchanges each month as a measure of investor behavior. Returns are annualized (and total return where applicable) and represent the 20-year period ending 12/31/15 to match Dalbar’s most recent analysis. Guide to the Markets – U.S. Data are as of September 30, 2016.