
By Corey Hoffstein and Justin Sibears, Newfound Research
Trend GDP growth is a critical determinant of traditional asset class returns. For equities, GDP growth has historically served as an upper bound to earnings growth. For bonds, short-term interest rates can be modeled as the sum of GDP growth, time preferences (i.e. the relative preference between saving and investment), and monetary policy effects.
When thinking about GDP growth, we prefer to follow an unbundle/re-build framework. With this approach, we unbundle the sources of GDP growth, analyzing each both individually and in concert with the other sources of growth, and only then re-aggregate the components to top level GDP growth.
There are a number of valid methodologies for decomposing GDP growth. In this piece, we will use a supply-side approach. The basics are as follows.
In the equation below, let Y denote real GDP and N denote total population. We can decompose real GDP per capita as follows:

where E is total employment and L is the working age population.
The first term on the right-hand side of the equation (Y/E) reflects the amount of output generated per worker. This is a measure of productivity.
The second term (E/L) is the proportion of the working age population that is employed. This will be a function of the labor force participation rate and the employment rate (one minus the unemployment rate).
The third term (L/N) is the percentage of the population that is of working age (16 years and older).
Once we understand the sources of per capita GDP (Y / N) growth, we can easily pivot to total GDP (Y) growth since total GDP growth will be approximately equal to the sum of per capita GDP growth and population growth.
A Case Study: Understanding Long-Term GDP Growth in the United States (1948 to 2015)
As a case study, let’s unbundle the sources of U.S. GDP growth from 1948 to 2015. In 1948, real GDP was $2.0 trillion in 2009 dollars. By 2015, real GDP had growth to $16.4 trillion, an annualized growth rate of 3.2%.
Of this 3.2% growth, a little less than two-thirds (2.0%) resulted from more output per person (i.e. growth in real per capita GDP). The remaining growth (1.2%) came simply from an increase in population.
We can go a step further by decomposing per capita GDP growth down to changes in productivity (output per worker), changes in the employment rate (the percentage of the working age population that is employed), and changes in population composition (the percentage of the population that is of working age).
The vast majority (~89%) of per capita GDP growth can be attributed to increases in productivity. Changes in the employment rate and population composition combined to contribute just 0.23% to real per capita GDP growth.
To gain more intuition around the drivers of productivity growth, we can break it into two components:
- Intra-sector productivity growth (e.g. farmers producing more output per worker).
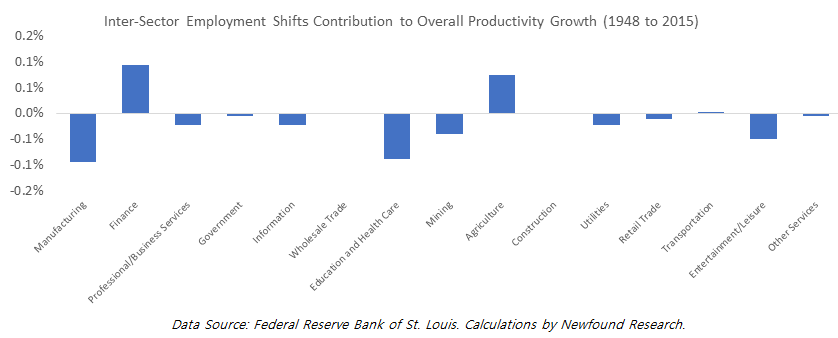
- Inter-sector employment shifts (e.g. workers moving from the farming sector to the manufacturing sector). If workers move from less productive sectors to more productive sectors, economy-wide productivity will increase. If workers move from more productive sectors to less productive sectors, economy-wide productivity will decline.
Decomposing Real GDP (1948 to 2015)

Productivity growth over the 1948 to 2015 period can be entirely attributed to intra-sector productivity growth. More than half of the productivity gains came from just three sectors: manufacturing, finance, and professional and business services (which includes many tech businesses).
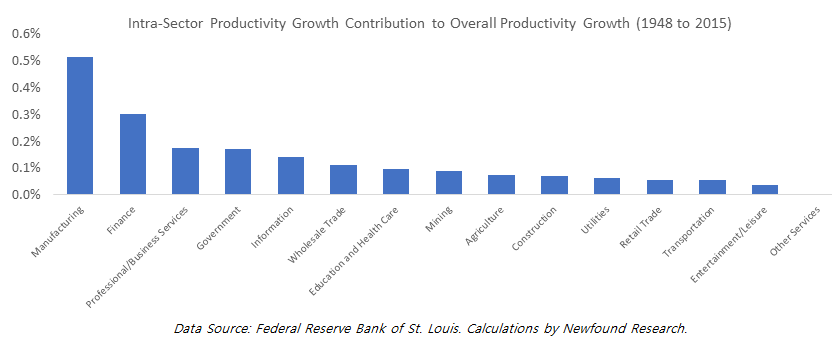
Inter-sector employment shifts were actually a modest detractor from productivity growth as workers on average moved from more productive to less productive industries.
Shortening the Time Horizon
It can also be informative to narrow our time horizon and consider shorter rolling periods. Below, we plot rolling 10-year GDP growth as well as the contribution of each of the main components discussed above.
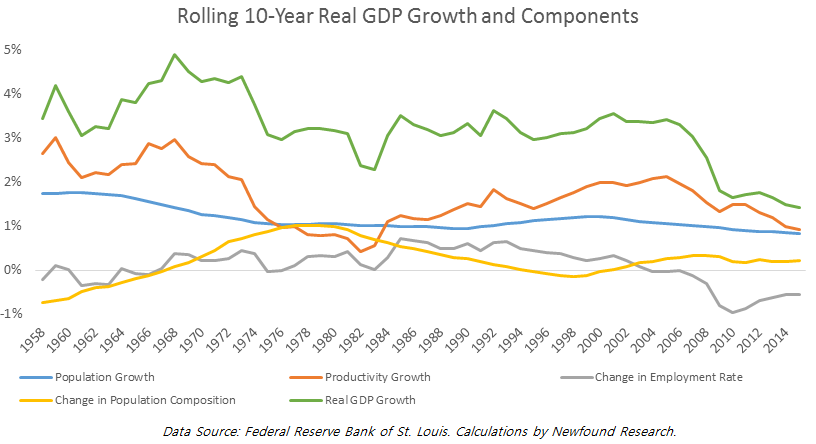
From the graph, it’s clear that real GDP growth has been slowing, especially over the last decade. From 1958 to 2007, the U.S. economy grew at 3%+ in 95% of rolling ten-year periods.
The economy has not returned to this growth rate since.
This decline been caused by both slowing productivity growth and unfavorable demographic developments. From a demographic perspective, two trends have combined to form a strong headwind for growth:
