
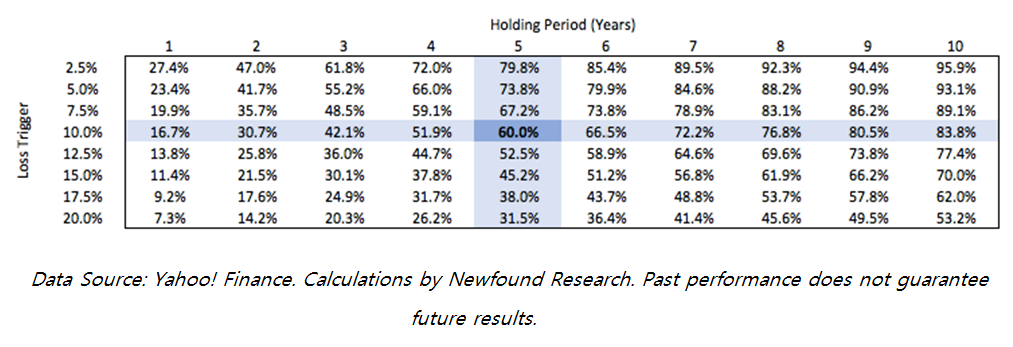
These stop-losses are counterproductive because they are almost guaranteed to be tripped, even by strategies exhibiting statistically significant alpha. Going back to the early 1980s, the “long/short” component of Buffett’s portfolio has had an annual return of 9.8% with volatility of 20.5%. Using this data, we can compute the probability of hitting certain informal stop-loss triggers over various holding periods.
How to read the table: The highlighted row (10% Loss Trigger) and column (5-Year Holding Period) means that the probability of seeing at least one year of 10%+ underperformance during a 5-year holding period is 60%. If an investor would fire a manager for this degree of underperformance, they would more likely than not fire Buffett within the next five years.
We see that the probability of hitting certain pain points is quite high, especially when the tolerance for relative underperformance is low and holding periods are long. And remember, this data is calibrated to reflect perhaps the best equity investor in history.
- Tracking error can be managed in the portfolio construction process.
Of course, none of this is meant to imply that investors have to just accept tracking error to the market. Different investors will have different tolerances for tracking error. In all likelihood, these tolerances will also change over time.
These preferences are best addressed in the portfolio construction process where asset classes and strategies are blended together. In fact, we explicitly account for the pain of tracking error to popular benchmarks when we construct our own strategic portfolios.
- Understanding when a strategy may excel and when it may struggle should be a core part of the diligence process.
We believe that by better understanding the potential magnitude and duration of underperformance, as well as the types of markets in which it is most likely to occur, investors can start to exhibit Buffett-like discipline.
To illustrate the initial steps of this type of analysis, let’s turn to an example that is near and dear to our hearts: momentum-based tactical equity.
We built a simple momentum strategy with a methodology similar to that used in AQR’s article “Back in the Hunt.” Using data from Fama and French, we measure the trailing 1-year return for large-cap U.S. equities. The allocation to equities ranges from 0% to 200% (i.e. no exposure to a 2x levered position) depending on how the most recent 1-year return compares to past 1-year returns. When the current return is above the historical median, the strategy will have more than 1x exposure to the equity market. When the current return is below the historical median, the strategy will have less than 1x exposure to the market. At each point in time, we only use data that would have been available to investors at that time (i.e. the median is computed on a rolling bias). This methodology is used to avoid hindsight bias.
Note: We use a 0% to 200% range for equity exposure as this allows us to both under and overweight equities. This mirrors the recommendation that clients use our tactical equity strategies – which can shift equity exposure between 0% and 100% – as a pivot between their stock and bond allocations. This pivot usage also allows for both the under and overweighting of equities.
This simple, hypothetical strategy beats the market by 86bps per year with a 20% reduction in the duration and magnitude of drawdowns. (All returns are backtested and hypothetical and this hypothetical strategy was created and performance was calculated in connection with the writing of this analysis. Index returns include the reinvestment of dividends and are gross of all fees and expenses. Past performance does not guarantee future results.)
Like with Buffett, we see that the long-term, risk-adjusted outperformance of the strategy does not eliminate the possibility of significant short-term underperformance.
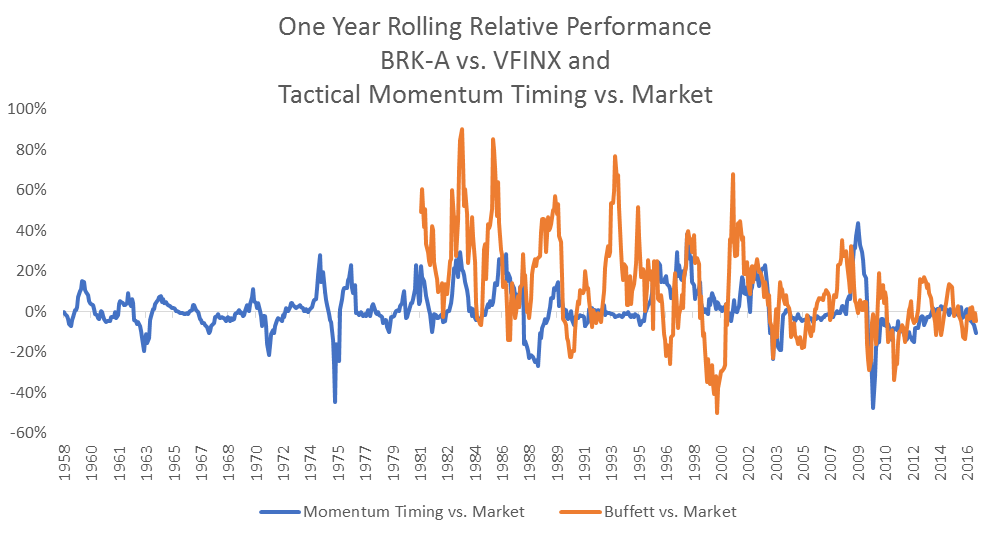
Data Source: Yahoo! Finance, Fama/French data website. Calculations by Newfound Research. Past performance does not guarantee future results. The momentum timing strategy is hypothetical and backtested. It reflects the reinvestment of dividends and does not include the payment of any fees or expenses. The index is not representative of any Newfound strategy or index.
The recent underperformance of the momentum strategy (+1.8% YTD through 9/30 compared to +7.5% for the market) is well within historical bounds.
Digging into the data a little deeper, we see that the tactical momentum strategy tends to outperform when the market is down and when the market is up big (30% or more). In more mild up markets, the strategy tends to underperform.
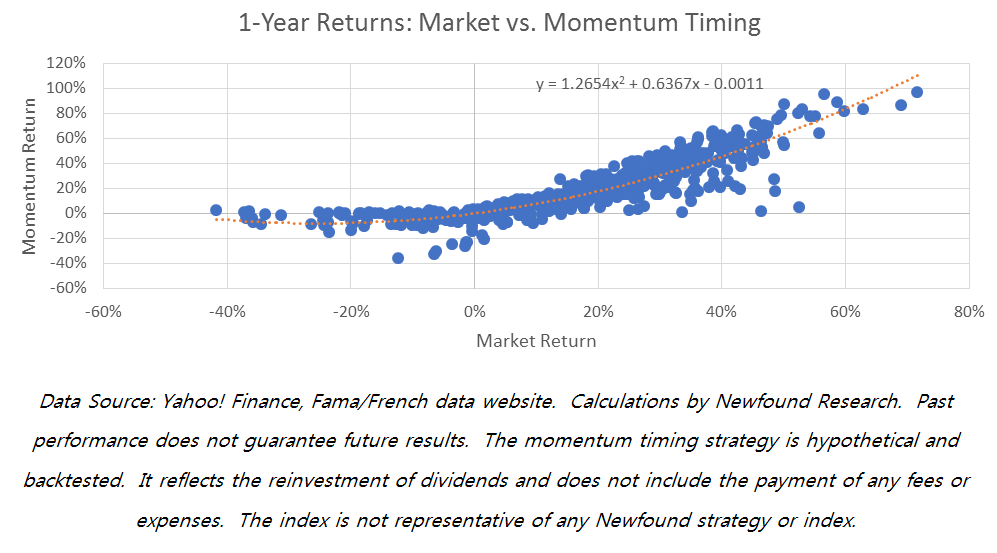
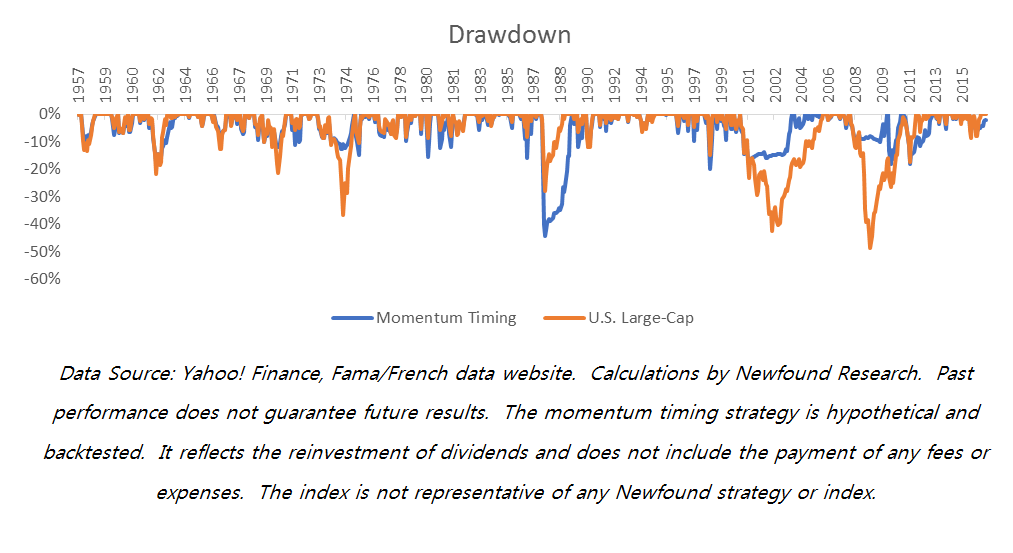
We can also use the data to set expectations around the risk-mitigating properties of momentum-driven tactical equity. We see below that the hypothetical strategy generally does a solid job protecting against large losses. In most cases, downside protection tends to kick in when the market is down between -10% and -20%.
That being said, we also see that momentum is not a perfect risk management tool. In 1987, the strategy actually would have been down more than the market. This makes sense since momentum is by definition backward, not forward, looking, and the strategy could be up to 2x levered. As a result, it is not equipped to deal with unexpected rapid sell-offs like what was seen in 1987. This is exactly why we advocate for a holistic approach to risk management, incorporating complementary tools like high quality fixed income, tactical asset allocation, and alternative strategies (e.g. managed futures).
Conclusion
No investor, not even the great Warren Buffett, is immune from bouts of short-term underperformance. Short-term underperformance is a necessary, if annoying, reality for investors seeking to outperform the market on a risk-adjusted basis.
Rather than engage in the fruitless pursuit of constant outperformance, investors should seek to fully understand how their asset classes, strategies, and managers may perform in different market regimes. This analysis can help users distinguish between benign underperformance and underperformance that may be a symptom of a serious problem (i.e. a manager deviating from his stated investment process).
Underperformance that occurs in environments where a strategy is expected to struggle may be good evidence of a manager staying true to his process.
