Following the outcome of the U.S. presidential and congressional elections, the market narrative switched to a focus on the new regime’s pro-growth agenda and concerns around the implied costs of increasing fiscal spending. Consequently, risky assets outperformed risk-off assets.
For example, equities and commodities outperformed sovereigns, and small capitalization equities outperformed large capitalization equities. Moreover, fixed income sovereigns experienced the worst monthly returns since September 2008.
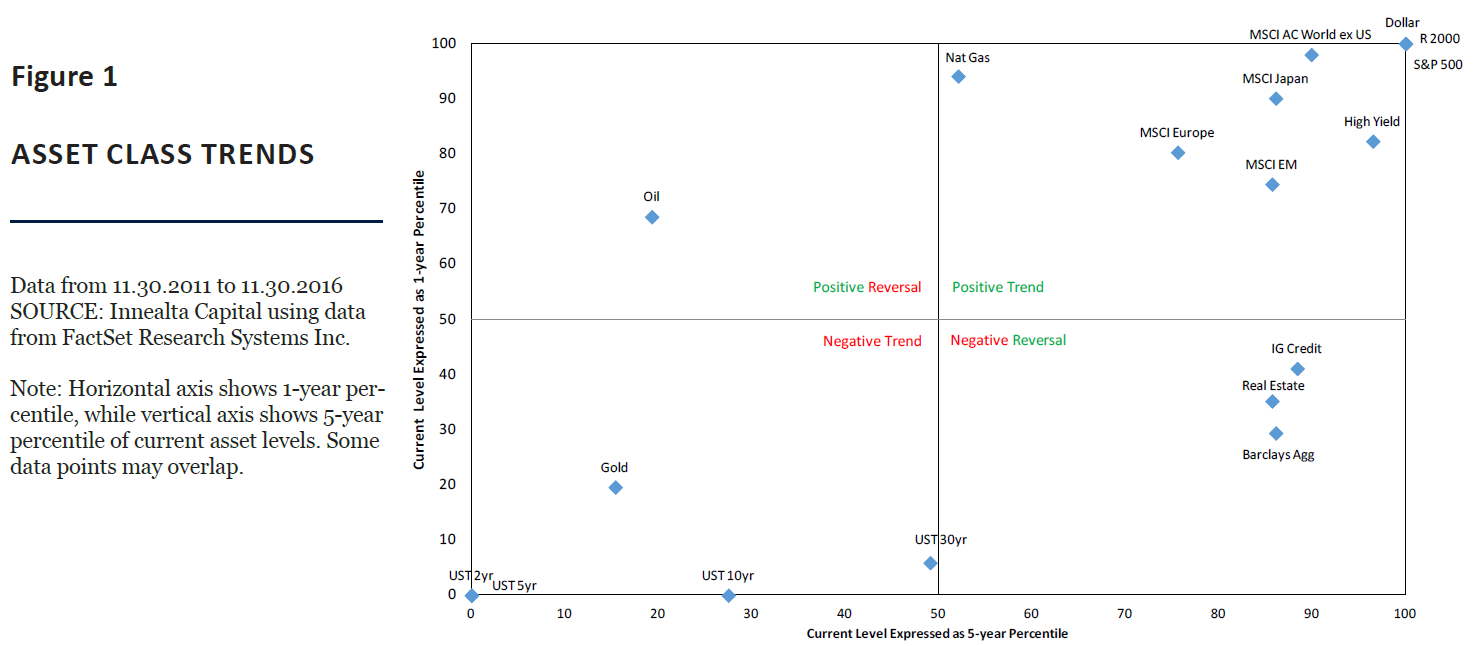
Figure 1 shows the snapshot of the current trends and reversal across global assets by plotting the current level of various asset classes using a short time frame, 1 year, and a longer time frame, 5 years. The data shows that risky assets remain on a positive trend, fixed income sovereigns remain on a negative trend, and fixed income investment grade credit is experiencing a negative reversal.
Overall, global asset performance during November continued to show high levels of return dispersion, which has become a recurring theme for 2016.
SURPRISING ELECTION OUTCOMES
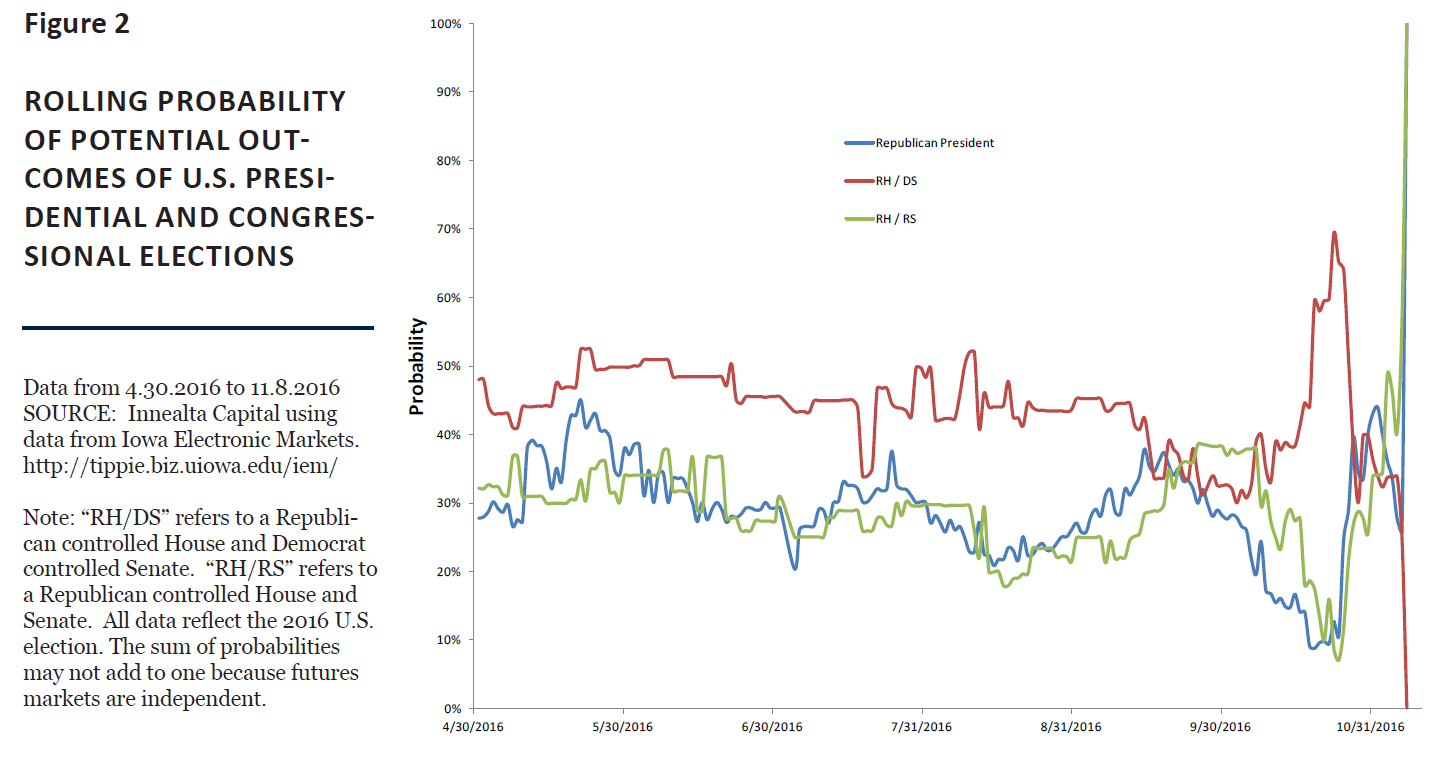
In the days prior to the election, the Iowa Electronic Markets futures implied a 90% probability of a Democrat Presidential win and a 65% probability of Democrat Senate win with a Republican House of Representatives. Financial and political analysts were in agreement with that shown in the futures and betting markets.
Figure 2 shows the evolution of the various election outcomes over time. Two weeks prior to the election, most political analysts assumed a Democratic president and a split House/Senate. This outcome would have implied a continued gridlock of legislative bills and reforms. Ultimately, Republicans shocked markets by gaining control of the executive branch and the totality of the legislative branch of the U.S. government. With the abrupt change in fiscal policy expectations following the election, investors adjusted their view and markets rallied.
BOND BEARS
Many of our readers may still be wondering: why did the bond market sell off immediately following the outcome of the U.S. presidential election? The most plausible thesis is that the election outcome would reduce Congressional gridlock and President-elect Trump’s fiscal policy will require significant amount of additional funding. The increase in funding and potential increase in debt-to-GDP forced fixed income investors to demand a higher yield for lending to the U.S. government. An alternative thesis is that the market began to accept the likelihood of sustainable, increased growth and needed to adjust its expectations relative to the FED.
Prior to the U.S. election, macroeconomic growth data had already been improving. U.S. corporate earnings, GDP, ISM Purchasing Managers’ Index, and consumer confidence were increasing and beating expectations. If the FED has more information about the overall state of the US economy, given its role, then the fixed income markets needed to readjust to FED expectations. Figure 3 shows the FOMC dot plot overlaid with the overnight index swaps (“OIS”) as of 09/21/16 and 11/30/16. Had fixed income market expectation matched the FED’s expectations, then the ‘OIS – As of Meeting Date’ line would overlap the ‘FOMC Dots Median’ line. However, since the last FED meeting, swaps terminating in 2019 moved from 82 bps to 157 bps. Although fixed income markets experienced a significant move in November, they still disagree with the FED on the terminal level of interest rates for 2017, 2018, and 2019.
MOVING FORWARD
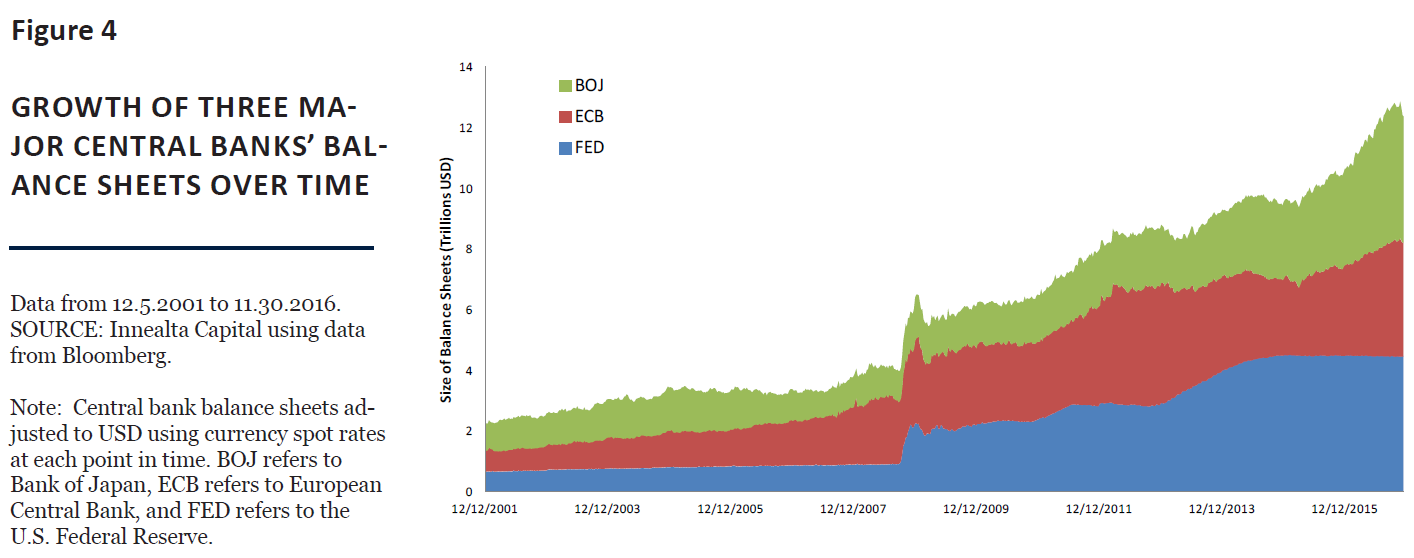
During the next few months, we expect two macroeconomic themes to dominate headlines and impact financial markets: President-elect Trump’s decisions and world monetary policy announcements. President-elect Trump’s choices of remaining cabinet positions and how he may pursue his various campaign promises will have meaningful market impacts. Currently, the market expects a pro-growth agenda that will reduce tax rates, increase fiscal stimulus, and increase national debt. On the monetary policy side, the European Central Bank (“ECB”) will meet on December 8th and the FED will meet on December 13th and 14th. Of the two, the ECB is more important. Figure 4 shows the combined balance sheets of the FED, European Central Bank, and the Bank of Japan (“BOJ”). Only the ECB and BOJ continue to increase their balance sheets through asset purchases and the market currently expects the ECB to extend its quantitative easing policy. If ECB fails to extend, then weakness in fixed income markets may persist. Looking forward, we expect a lower level of market volatility for the remainder of the year, but we acknowledge that with Donald Trump we will likely see an increase in periods of episodic asset volatility.
SUMMARY
Global asset markets experienced significant moves during November following the outcome of the U.S. presidential and congressional elections. Risky assets such as commodities and equities performed well while risk-off assets such as fixed income sovereigns performed poorly. The election outcome was a surprise to many financial and political analysts. Yet even before the election, the strength of the U.S. economy, as measured by macroeconomic data, was improving. The election forced investors to evaluate the impact of a future fiscal policy that will likely increase the national debt but could possibly stimulate more growth. Heading into December, we expect subdued volatility as the remaining market headlines will be President-elect Trump’s cabinet decisions and the European Central Bank monetary policy decision. Should the recent market rally extend beyond 2016, we believe investment opportunities to be numerous as the economy gains strength and asset class return dispersions return to a healthy level.
This article was written by Innealta Capital, a participant in the ETF Strategist Channel.
IMPORTANT INFORMATION
The information provided comes from independent sources believed reliable, but accuracy is not guaranteed and has not been independently verified. The security information, portfolio management and tactical decision process are opinions of Innealta Capital (Innealta), and the performance results of such recommendations are subject to risks and uncertainties. Past performance is not a guarantee of future results.
Any investment is subject to risk. Exchange traded funds (ETFs) are subject to risks similar to those of stocks, such as market risk, and investors that have their funds invested in accordance with the portfolios may experience losses. Additionally, fixed income (bond) ETFs are subject to interest rate risk which is the risk that debt securities in a portfolio will decline in value because of increases in market interest rates. The value of an investment and the return on invested capital will fluctuate over time and, when sold or redeemed, may be worth less than its original cost. This material is not intended as and should not be used to provide investment advice and is not an offer to sell a security or a solicitation or an offer, or a recommendation, to buy a security. Investors should consult with an investment advisor to determine the appropriate investment vehicle. Investment decisions should be made based on the investor’s specific financial needs and objectives, goals, time horizon and risk tolerance. All opinions and views constitute our judgments as of the date of writing and are subject to change at any time without notice.
Figures 1 References:
UST 2Y refers to the FactSet total return index of owning 2-year U.S. Treasuries. S&P 500 denotes the S&P 500 Index. Real Estate refers to The Dow Jones U.S. Select REIT Index, which intends to measure the performance of publicly traded REITs and REIT-like securities. UST 5y refers to the FactSet total return index of owning 5-year U.S. treasuries. MSCI JAPAN refers to the The MSCI Japan Index which is designed to measure the performance of the large and mid cap segments of the Japanese market. MSCI Europe refers to the MSCI Europe Index, a free float‐adjusted market capitalization weighted index that is designed to measure the equity market performance of the developed markets in Europe. UST 30y refers to the FactSet total return index of owning 30-year U.S. treasuries. UST 10y refers to the FactSet total return index of owning 10-year U.S. treasuries. MSCI AC World ex US refers to the MSCI ACWI ex. U.S. Index, a market capitalization weighted index that is designed to measure the equity market performance of developed and emerging markets excluding the United States. IG Credit refers to the iBoxx USD Liquid Investment Grade Index, an index composed of U.S. dollar-denominated, investment-grade corporate bonds. MSCI EM refers to the MSCI Emerging Markets Index, which captures large and mid cap representation across 23 Emerging Markets (EM) countries. Gold refers to the Gold NYMEX Near Term ($/ozt). NatGas denotes Natural Gas NYMEX Near Term ($/btu). High Yield refers to the iBoxx USD Liquid High Yield Index, an index composed of U.S. dollar-denominated, investment-grade corporate bonds. Oil refers to Crude Oil WTI / Global Spot NYMEX. Dollar refers to the U.S. dollar index (USDX), a measure of the value of the U.S. dollar relative to the value of a basket of currencies of the majority of the U.S.’s most significant trading partners. R 2000 refers to the Russell 2000 Index (Small Cap Equity), which measures the performance of the small-cap segment of the U.S. equity universe and is comprised of the smallest 2000 companies in the Russell 3000 Index. Barclays Agg refers to the Barclays Capital U.S. Aggregate Bond Index (Aggregate Bond), which measures the performance of the U.S. investment grade bond market.
It is not possible to invest directly in an index.
AFAM Capital, Inc. is a registered investment adviser. Al Frank Asset Management and Innealta Capital are divisions of AFAM Capital. AFAM is editor of The Prudent Speculator newsletter and is the investment advisor to individually managed client accounts and certain mutual funds. For more information, please visit afamcapital.com. Registration as an investment advisor does not imply any certain level of skill or training.
Innealta is an asset manager specializing in the active management of portfolios of ETFs. Contact your financial advisor for additional information. 404-AFAM-12/09/2016