
At Newfound, we have a simple statement that we like to live by when advising clients: “Risk cannot be destroyed, it can only be transformed.”
With this in mind, we’d like to spend the rest of this article identifying some of the risks of low volatility strategies. Just to be clear, none of what we are about to discuss is meant to discourage use of these strategies. All investment approaches have risk. Our goal is to bring these risks to the forefront so that they can be addressed during the overall portfolio construction process.
Low Volatility X-Ray
One way we can go about trying to identify risk is with a factor model. A factor model attempts to decompose the returns of a security, asset class, or strategy. The simplest, and most famous, factor model is CAPM. CAPM uses a single factor: the market. Another famous factor model is the Fama-French three-factor model, which adds size and value to the equation.
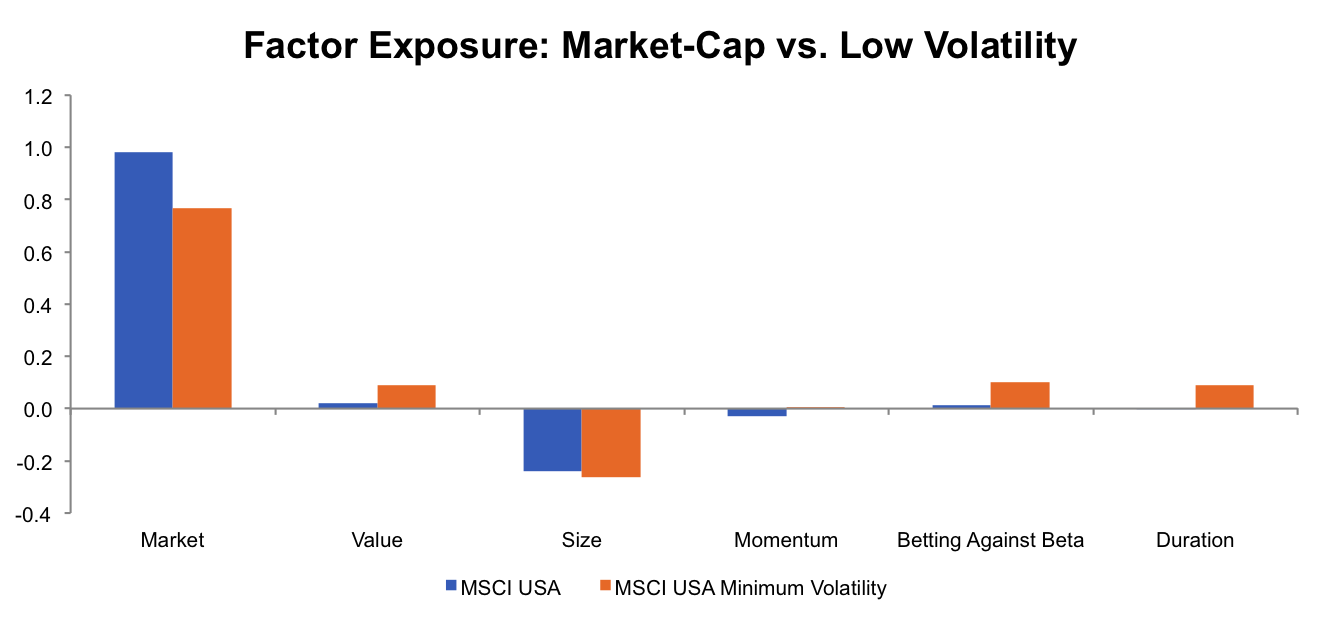
For this exercise, we are going to follow the approach used by Research Affiliates in a 2014 paper titled “A Study of Low-Volatility Portfolio Construction Methods.” We used the model to decompose the returns of the market-cap weighed MSCI USA Standard (Large + Mid-Cap) Index and the MSCI USA Minimum Volatility Index.
Source: Data from MSCI and AQR, Calculations by Newfound Research. Past performance does not guarantee future results. Covers the period from June 1988 to May 2016.
Unsurprisingly, the market-cap weighted MSCI USA Index is dominated by market risk. The negative exposure to the size factor results from the fact that the MSCI indices are large/mid-cap and so are biased away from small-cap exposure.
The low volatility index, on the other hand, has significantly less market exposure. Yet, it has higher exposure to the value, size, betting against beta, and duration factors. Low volatility strategies do not have less risk; they just have different risks. Realized volatility has been lower than the market-cap weighted benchmark because these different factors have historically done a good job of diversifying each other.
Risk #1: Interest Rate Exposure
The exposure analysis shows that historically low volatility strategies have positive exposure to the Duration factor. This implies that they, like bonds, have tended to benefit from falling interest rates. The loading – or exposure – of the MSCI USA Minimum Volatility Index to the Duration factor has been approximately 0.09 over the period studied. In simple terms, this means that a 1.00% excess return for 10-year Treasuries has contributed approximately 0.09% towards the return of the low volatility strategy. Likewise, a 1.00% loss for 10-year Treasuries would cause a 0.09% performance drag for low volatility equity strategies.
We think this is important for three reasons.
- Rising rates may cause performance drag.
- In the event that rising rates cause an equity downturn, there is the risk that the historically negative correlations between the Market factor and the Duration factor could turn positive, reducing potential for volatility reduction.
- In the 1988 to 2016 period, the Duration factor returned 5.7% annually as rates fell pretty consistently during this period. With a loading of 0.09, this means that stellar bond returns caused by falling rates contributed about 50bps per year to low volatility returns. Unless rates fall far into negative territory, this tailwind for low volatility returns will likely be limited going forward.
Risk #2: Changing Exposures
The low volatility X-ray presented earlier summarizes a 28-year period. As we mentioned earlier, low volatility strategies tend to have quite a bit of turnover. As a result, the exposures presented in the X-ray can change significantly over time. Below, we plot the value exposure of the MSCI USA Minimum Volatility Index over rolling 3-year periods. As the X-ray indicates, the average exposure to value is generally positive. However, it has dipped negative recently. This implies that recent constituents are actually overvalued relative to other stocks in the universe.
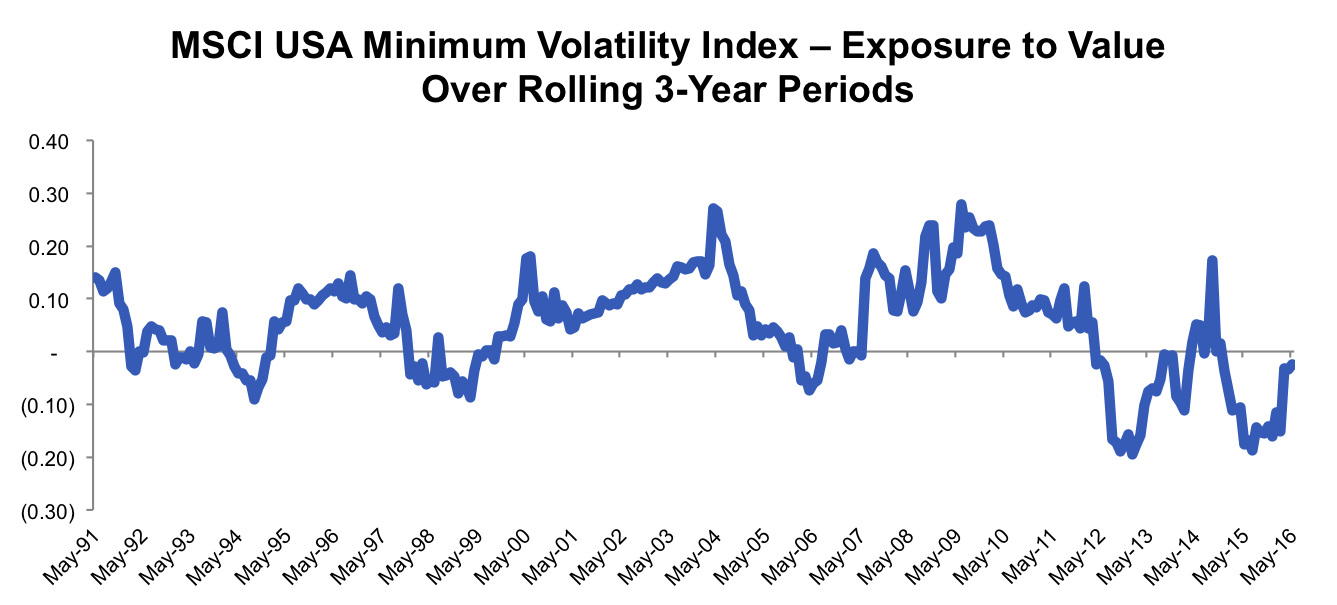
Source: Data from MSCI and AQR, Calculations by Newfound Research. Past performance does not guarantee future results. Covers the period from June 1988 to May 2016.
Of course, this does not necessarily mean that trouble is around the corner. It does suggest, however, that the strategy, since it doesn’t account for price in its buy/sell decisions, can potentially get over-concentrated in expensive companies. This may expose the strategy to losses if a bubble develops in lower volatility stocks and then it pops before the strategy has the ability to reduce exposure.
Risk #3: Expectations
This one is simple. No factor strategy, even low volatility, is perfect. Low volatility strategies have gone through periods of significant underperformance in the past and they will again in the future. When this does happen, it’s crucial to remember that this is just part of the ride and no reason to abandon ship.
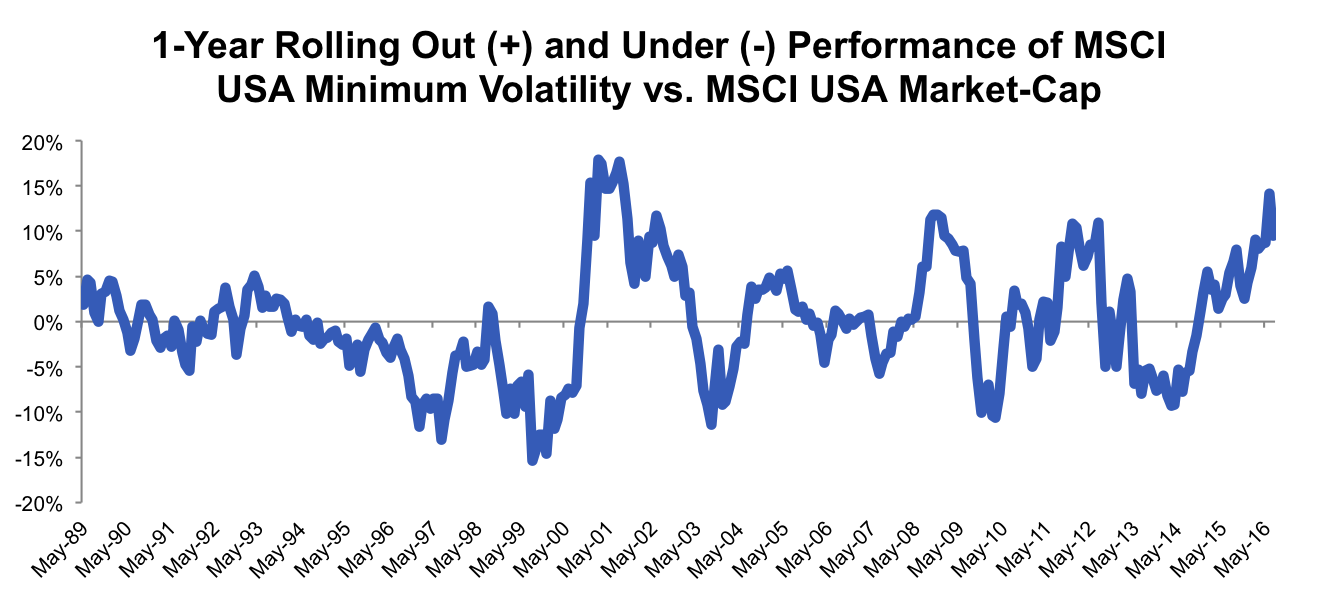
Source: Data from MSCI, Calculations by Newfound Research. Past performance does not guarantee future results. Covers the period from June 1988 to May 2016.
Risk #4: Process Risk
No process is perfect. Low volatility strategies use trailing volatility as a proxy for risk. Trailing volatility is appealing for its simplicity and timeliness. However, it has its drawbacks as well. Trailing volatility can fail to accurately forecast future volatility. In addition, it ignores additional information that may be available about a company (e.g. financial statement data).
In our opinion, one of the most powerful ways to address process risk – and many other risks specific to a given strategy – is through strategy diversification. In this context, strategy diversification means finding other managers or strategies that further the goal of risk aware equity exposure while mitigating the risks a pure low volatility approach.
A Case Study in Strategy Diversification
For an investor looking for lower risk exposure to the equity markets, the process might go something like this:
- Start with a low volatility ETF like USMV (tracks the MSCI USA Minimum Volatility Index)
- Recognize that volatility isn’t the only measure of company risk and so complement USMV with another strategy that measures risk through a different lens. This complement could be a quality ETF that uses fundamental measures of risk like earnings growth or a dividend growth ETF. For this example, we will use NOBL, a ProShares ETF that tracks the S&P 500 Dividend Aristocrats ETF. This strategy invests in U.S. large-cap companies with a 25+ year history of growing their dividend.
- The potential risk with both USMV and NOBL is that neither uses price in their security selection or weighting methodology. This suggests that we could be exposed to stock bubbles to the extent that inflated companies find their way into either strategy. We can address this by adding a strategy that will maintain a more consistent value tilt. In the U.S. large-cap sleeve, this could mean an ETF like RSP that tracks the S&P 500 Equal Weight Index. This product will hold roughly equal amounts of each S&P 500 constituent. It tends to have a significant value tilt without roaming into deep value territory that might do more harm than good for risk averse equity investors.
- Finally, we recognize diversification isn’t perfect. In markets like 2008, when most companies are crashing simultaneously, there is a limit on the amount of protection that diversification can offer. For these scenarios, we add in a bit of tactical equity. For this sleeve, we constructed a hypothetical strategy that uses momentum to allocate between equities and short-term U.S. Treasuries.
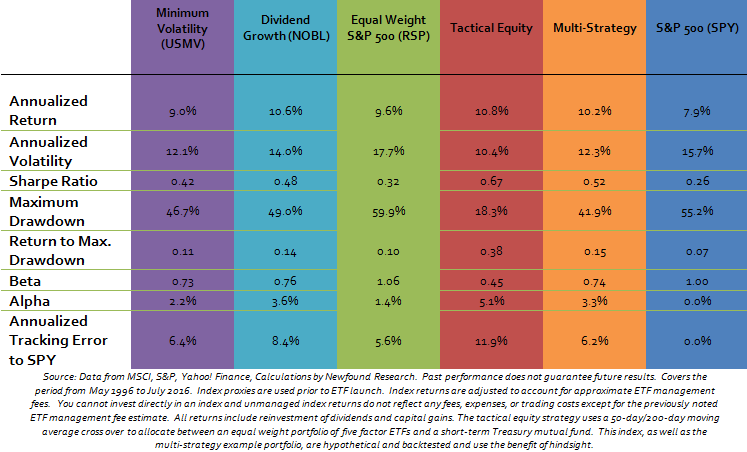
To keep things simple, let’s assume an equal allocation to each of these four strategies.

Below we present summary statistics for each of the sleeves as well as the hypothetical multi-strategy portfolio. We see that the multi-strategy portfolio is able to offer similar risk metrics to a pure low volatility approach with higher risk-adjusted returns.
More importantly, we avoid having our success or failure ride on a single approach. In normal market environments, this can reduce tracking error to the market, making it easier to manage client expectations. In times of market crisis, it increases the odds that the portfolio will be equipped to deal with the next crash regardless of what it looks like.
Performance Comparison
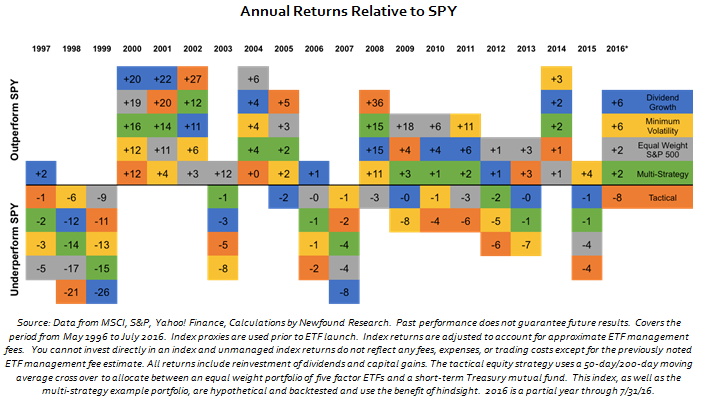
Low volatility equity ETFs provide investors with valuable building blocks when constructing risk-managed portfolios. Yet, low volatility is not low risk. Instead, these strategies typically trade a bit of market risk for exposure to other risks, including interest rate risk, client expectation risk, and process risk. One way to mitigate these risks is to complement low volatility equities with other strategies that use different means to get to the same end: risk-managed equity exposure. Potential complementary strategies may include quality, dividend growth, value, and tactical equity.
Disclosure Information
Certain information contained in this presentation constitutes “forward-looking statements,” which can be identified by the use of forward-looking terminology such as “may,” “will,” “should,” “expect,” “anticipate,” “project,” “estimate,” “intend,” “continue,” or “believe,” or the negatives thereof or other variations or comparable terminology. Due to various risks and uncertainties, actual events or results or the actual performance of an investment managed using any of the investment strategies or styles described in this document may differ materially from those reflected in such forward-looking statements. The information in this presentation is made available on an “as is,” without representation or warranty basis.
There can be no assurance that any investment strategy or style will achieve any level of performance, and investment results may vary substantially from year to year or even from month to month. An investor could lose all or substantially all of his or her investment. Both the use of a single adviser and the focus on a single investment strategy could result in the lack of diversification and consequently, higher risk. The information herein is not intended to provide, and should not be relied upon for, accounting, legal or tax advice or investment recommendations. You should consult your investment adviser, tax, legal, accounting or other advisors about the matters discussed herein. These materials represent an assessment of the market environment at specific points in time and are intended neither to be a guarantee of future events nor as a primary basis for investment decisions. Past performance s not indicative of future performance and investments in equity securities do present risk of loss.
Investors should understand that while performance results may show a general rising trend at times, there is no assurance that any such trends will continue. If such trends are broken, then investors may experience real losses. The information included in this presentation reflects the different assumptions, views and analytical methods of Newfound as of the date of this presentation. This document contains the opinions of the managers and such opinions are subject to change without notice. This document has been distributed for informational purposes only and should not be considered as investment advice or a recommendation of any particular security, strategy or investment product. This document does not reflect the actual performance results of any Newfound investment strategy or index.
No part of this document may be reproduced in any form, or referred to in any other publication, without express written permission from Newfound Research.
