Note: This article appears on the ETFtrends.com Strategist Channel
By Scott Kubie, CFA
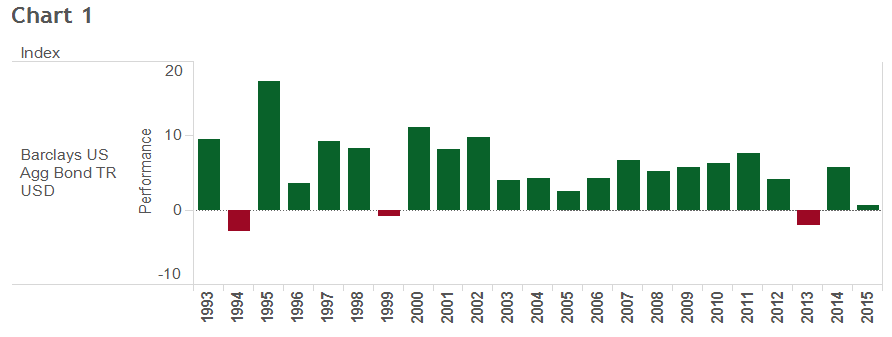
How risky can bonds be? They have only declined in three of the last 23 years, as measured by the Barclays U.S. Aggregate Bond Index and shown in Chart 1. Negative performance less than 13% of the time doesn’t seem very risky. Only two of those years, 1994 and 2013, posted returns lower than -2%, and all three negative years were followed by excellent returns. Hardly any risk there.
But bonds are much riskier than these numbers suggest. By modifying our assumptions slightly, the probability for negative returns increases to between 30% and 60%, and the potential loss increases to a much higher level than seen in Chart 1.
By examining the historical data more closely, we discover three differences that separate today’s market from its track record. By making modest analytical adjustments, the data leads to the conclusion that bonds aren’t as safe as expected.
Related: Factor Seasonality – Analyzing a Variety of Investing Behaviors
Adjustment 1: A Lower Risk-Free Rate
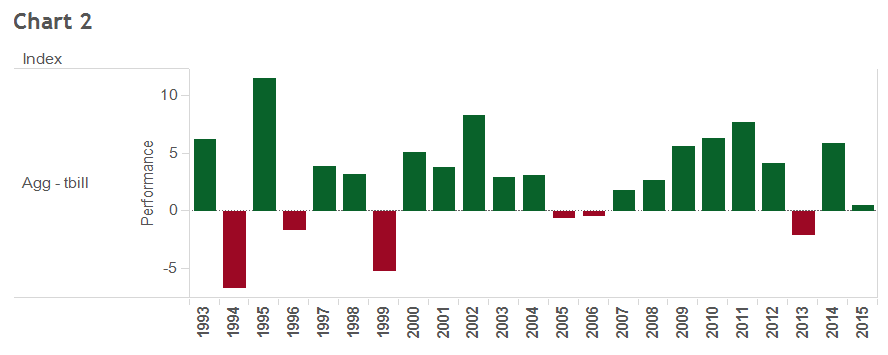
The data in Chart 1 benefits from a higher risk-free rate. Prior to 2008, T-Bills yielded above 4%. Chart 2 adjusts the historical return by subtracting the risk-free rate from the bonds. This chart shows the negative price returns from bonds are more frequent and significantly deeper than Chart 1. Since the current risk-free rate is near zero, this chart provides a better estimate of how far bond funds could decline in a given year.
For example, 1994 goes from losing 2.9% to dropping 6.7%. 1999, which was just barely negative, would have lost more than 5% if there wasn’t a positive T-Bill yield to support it.
Adjustment 2: Increased Duration
A second difference between now and the period measured in the historical data is the duration of the index. Duration measures the sensitivity of bonds to changes in rates. As the average yields on bonds in the index drop, the index becomes more sensitive to changes in rates. Prior to 2008, the bond market had a duration of around 4.5. The duration has increased 20% since that period and now resides at 5.4. If rates increase, the price affect will likely be greater than it has been in the past. So losses should be larger.
Adjustment 3: Rates Will Stop Falling
The third difference is the historical period benefits from a continued decline in yields for bonds. In 1993, yields were 5.85%. That’s 3% higher than today. After the decline in 1994, the Aggregate Bond Index yielded 7.2%! Yields declined because short- and long-term rates fell and the difference between long- and short-term rates narrowed. This decline pushed returns higher during many of these years, giving bond investors extra reward for bearing the rare negative year.
Estimating the Probabilities
Should yields start to increase, we would expect more frequent negative periods for bonds. The spread between short- and long-term rates, which is very tight, will likely widen if rates rise. While Chart 1 suggests bonds go up almost all the time, quarterly data reports that even when yields are generally dropping, bonds underperformed cash 38% of the time. As Charts 3a, 3b, and 3c show (see below), when rates start going up (negative performance), it is common for bonds to lag cash for a string of quarters.
Historical analysis suggests bonds ought to produce negative returns around 15% of the time and drop about 3% per year. In today’s market, a baseline assumption of 38% and potential underperformance of single digits seems right. Given the high duration inherent in the index and assuming a neutral rate environment, the opportunity for loss seems to be around 50%. Bond investors should remain open to the possibility of a decline of 10%, as today’s environment provides an opportunity for a sharp change in yields.
Related: No, This is Not an Ugly Chart on Factor Investing
Bonds maintain an important role in portfolio management. They reduce risk and often provide uncorrelated returns. In recent years they may have done this job too well. Given today’s environment, banking on the historical track record doesn’t make sense.
Note: The author wishes to thank Josh Jenkins, CFA and Raef Kubie for their research support.