
If companies with higher EPS growth rates are undervalued as a class, they can actually represent a significant portion of Value, rather than Growth. At any rate, longer term “reversion to the mean” tendencies clearly favor lower value (which can improve) over faster price momentum (which can worsen).
S&P 500 Value returns over the long term are much better than S&P 500 Growth
The result of the mean-reversion biased stock selection methodology clearly shows in the very long term relative performance of Value vs. Growth. Examining returns for each decade, we see Value +7.8% over Growth per year in the 1970’s, +4.4% in the 1980’s, and +2.1% in the 2000’s. Only in the 1990’s (thanks to the technology stock momentum bubble) did Growth outperform over a decade, beating Value by +6.0% per year.
Despite periods of Growth outperformance, Value is well ahead when we take a truly long term perspective. Investors may thus consider their own bias: overweighting IVE versus IVW unless the inputs from your process favor a tactical overweight to Growth.
Recent Growth vs Value results run counter to the longer term trends
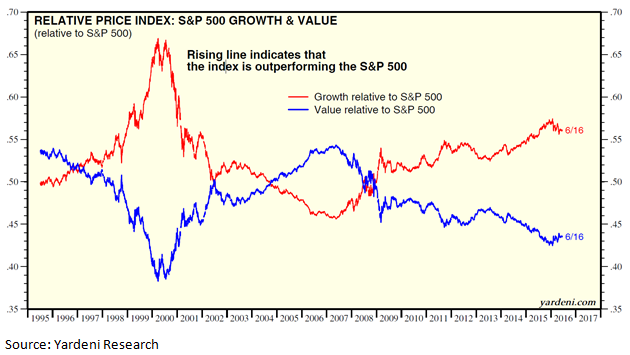
The following chart (courtesy of Yardeni research) shows periods of Growth outperformance (when the red line is rising) and Value leadership (a rising blue line). Make no mistake, the chart demonstrates the S&P Value Index has been drubbed by S&P Growth over the past several years.
In fact, the point-to-point upward slanting red line from 1995 to May 2016 reveals a sizeable outperformance from Growth. Through May 2016, Growth is ahead of Value by annualized rates of +3.88%, +2.21% and +3.29% over the past 3, 5 and 10 year periods.
This might appear to refute our theme of Value leadership over time. However, just a small change in the starting point to May 1996 on the chart (thus establishing a 20 year measurement) reduces the Growth advantage to about 0.7% annually.
Another critical takeaway from this chart is that the 2015 peak level of Growth outperformance remains well below the 1999 Growth peak. As the remainder of the 1995-1999 Growth leadership spike falls out of the 20 year timeframe, Value is likely to reclaim the long term leadership title. We believe Growth’s peak-to-peak record of trailing Value further supports our opinion that investors should consider overweighting the S&P Value Index over time.
Related: Some Things Never Change in Investing…or Do They?
To conclude this leadership review, we note Growth’s leadership ended in 2000, then Value led into 2007 before the current Growth leadership cycle commenced. Is it ending now? Nobody knows, but year-to-date through May, Value (+5.31%) crushed Growth (+1.91%) by over 3%.
This cyclicality fits nicely with the TOPS strategic approach to active indexing which calls for taking a 1-3 year prospective view on an asset class or ETF before making any changes to portfolio allocations. An important tool for equity ETF analysis is analyzing each index’s price/earnings ratio versus its historic norms since 1995. We prefer to maintain heavier weightings to indexes that are toward the lower end of their historic range. From that perspective, the factors used by Standard & Poor’s sausage-making is complementary to our decisions as to which “sausage” to buy.
Extreme sector weight differentials are important to consider
Additional factors also come into play. Investors should pay attention to the sector weights of the underlying indexes. A recent paper written by Sam Stovall of S&P Global (May 2016 – What Drives Growth & Value?) shows the sector composition of Value and Growth plays a large role in relative performance. For instance, the Technology sector always accounts for a much larger percentage of Growth than Value, while Financials are heavily skewed in the opposite direction. S&P’s research shows a positive 52% Tech correlation and negative 16% Financials correlation with Growth outperformance. Combining the correlations of the two sectors generates a coefficient of 73%, which Stovall notes is a pretty convincing result.
Currently, Tech is 31.5% of Growth and only 7.7% of Value, while Financials are 7.9% of Growth and 24.4% of Value. Thinking back to factors used by S&P to allocate companies to Value and Growth, it’s no surprise to see that higher-valued Tech will be in Growth and lower-valued Financials in Value. If an investor has a strong opinion about the future performance of those sectors, it could impact their portfolio positioning of Growth vs Value. Sector weights also help Value total returns relative to Growth, as dividend yields are generally higher for Value-overweight sectors including Financials, Energy, Utilities and Telecom.
While markers are in place, the timing of a leadership reversal cannot be forecasted
We believe a leadership reversal is inevitable but the exact timing is unforecastable. Markers in place include:
- Mean reversion. Trees don’t grow to the sky and momentum stocks eventually falter. When that occurs, Value will take command of the performance derby.
- Absolute valuations for Value are lower than for Growth, but both are above-average according to our research. Roughly 37% of Value market cap is in Financials and Energy, both of which have the potential for improved EPS comparisons (which would mean the current P/E is overstated). For Growth, 50% is in Tech and Consumer Discretion and both sectors have optimistic forward EPS expectations. Any EPS disappointment would leave the current P/E understated.
- The cycle of Growth outperformance is stretched. Recent strong results from Value should be monitored closely, as it could be an early sign of a new cycle in favor of Value.
So, to answer the question posed by our title, a leadership reversal should not be surprising. When (not if) that occurs, investors may want to shift toward Value as the combination of longer term trends and cyclical leadership could be a solid plus for portfolio performance.
Robert Leggett is Senior Portfolio Advisor of TOPS/ValMark Advisers, a participant in the ETF Strategist Channel.
[related_stories]IVE, IVW, IWD, IWF, SPXL, SPXS and XT have been, may be and/or are currently held in several TOPS® Portfolios. Charts are for illustrative purposes only and do not reflect an actual client experience. ValMark Advisers, Inc. (“ValMark”) is a federally registered investment adviser located in Akron, Ohio. ValMark and its representatives are in compliance with the current registration and notice filing requirements imposed upon federally covered investment advisers by those states in which ValMark maintains clients. For registration or additional information about ValMark, including its services and fees, a copy of our Form ADV is available upon request by contacting ValMark at 1-800-765-5201. This article provides commentary on current economic and market conditions and is not directly relevant to any particular client account. The information contained herein should not be construed as personalized investment advice or recommendations to buy or sell any security. There can be no assurance that the views and opinions expressed in this article will come to pass. Investing involves the risk of loss, including the loss of principal. Past performance is no guarantee of future results. Information contained herein is subject to change without notice and should not be considered as a solicitation to buy or sell any security. Indexes are unmanaged and cannot be directly invested in. TOPS® is a registered trademark of ValMark Advisers, Inc. Diversification does not prevent or guarantee against loss.
