By Tyler Denholm, CFA – VP Investment Management & Research – TOPS ETF Portfolios
As a portfolio manager, friends and family (and sometimes random people) will ask me about stock market performance and/or try to get advice on how they should invest extra funds. At least I’m not a doctor, however, I can only imagine the questions they get asked. I think I’ll stick to talking about economics and investing.
The conversation usually begins like this:
Friend: “You work in the financial industry; what do you think about the current stock market?”
Financial Professional: <Insert comments on valuations, geo-political risks and/or economic risks.>
Friend: “I have some money on the sidelines that I have been wanting to invest but the market is at an all-time high so I’ll just wait for a pullback.”
Financial Professional: “It’s about time in the market…not timing the market.”
The “all-time high” comment has become a very common concern for retail investors since the beginning of 2013, when the S&P 500 price index surpassed the previous high from before the Great Recession. With fears still fresh from 2007, many investors assume that a new stock market high is indicative of a market gone wild. However, just because the market is making new highs, does not mean investors should sit on the sidelines. In 1937, the S&P 500 was at about 18. With the index now over 2,160, that means we have reached over 2,100 new all-time highs in the last 79 years. Not exactly our first rodeo.
Related: Is a Growth-to-Value Leadership Change Underway?
Analysis of Past Market Highs
Historically, the stock market has had a number of peaks, followed by bear markets which then lead to bull markets that surpass the previous highs. In the table below, nine such market cycles have been analyzed. On the left is the date and value of the S&P 500 price index showing a market peak just prior to a bear market. The middle column shows the date post-bear market when the market reclaimed its previous high. The last column shows the date the market peaked again before another bear market.
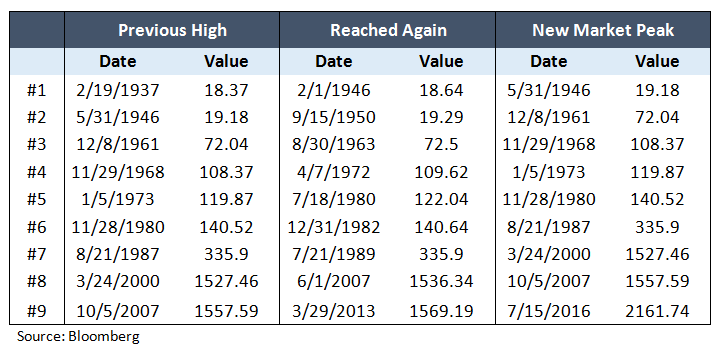
Based on this information, we then calculated how long the market continued its gains before another bear market – essentially, the time period between the middle column and the last column. Also calculated was the price return (not including dividends) during this time period.
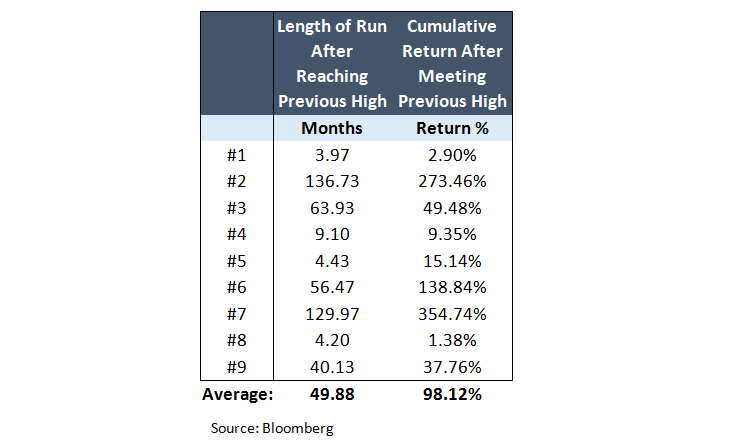
The Past is not a Fortune Teller
What can be discerned from this data is that in the simplest form, the reaching of an “all-time high” is not an indicator of future results. A third of the time (events #1, #5 and #8), the bull run only continued for about four months with an average return in the single digits. However, almost half of the time, the bull run continued for longer than 4 years…and in two cases, longer than 10 years! In these four longer runs, the average return was over 200%. On average, once the new bull market has surpassed its previous high, it typically continues for another 50 months with a return close to 100%.
Long Term Investors Should Not Fear
The Financial Times published an article recently entitled, “’Nifty Fifty’ Dents US Stock Bubble Fear.” In it, they discuss the fear in the current market based on exclamations that we must be in a bubble because the market is reaching new highs. They also cite the work of University of Pennsylvania Professor Jeremy Siegel related to the ‘Nifty Fifty’ stocks. In the early 1970s, these stocks had been bid up to extreme valuations. As an example, during 1972 Coca-Cola at one point was trading at a PE of 92, Disney was selling at 71 and Philip Morris was priced at 78. When Professor Siegel authored his paper in 1996, he showed that if investors had bought all of the stocks in the Nifty Fifty, even at their extreme valuations, they would have had annualized returns in the double digits.
This leads us back to the closing statement by the Financial Professional – “It’s about time in the market…not timing the market.” While we have all heard this saying, many investors have a hard time following these words. Instead of worrying about timing entry points, long term investors may be better off spending their energy and time on a factor that has been shown to have a greater impact, their asset allocation.
Tyler Denholm, CFA, is VP Investment Management & Research at TOPS/ValMark Advisers, a participant in the ETF Strategist Channel.
[related_stories]Important Disclosure
ValMark Advisers, Inc. (“ValMark”) is a federally registered investment adviser located in Akron, Ohio. ValMark and its representatives are in compliance with the current registration and notice filing requirements imposed upon federally covered investment advisers by those states in which ValMark maintains clients. For registration or additional information about ValMark, including its services and fees, a copy of our Form ADV is available upon request by contacting ValMark at 1-800-765-5201. This article provides commentary on current economic and market conditions and is not directly relevant to any particular client account. The information contained herein should not be construed as personalized investment advice or recommendations to buy or sell any security. There can be no assurance that the views and opinions expressed in this article will come to pass. Investing involves the risk of loss, including the loss of principal. Past performance is no guarantee of future results. Information contained herein is subject to change without notice and should not be considered as a solicitation to buy or sell any security. Indexes are unmanaged and cannot be directly invested in. TOPS® is a registered trademark of ValMark Advisers, Inc. Diversification does not prevent or guarantee against loss.