Note: This article appears on the ETFtrends.com Strategist Channel
By Giralda Advisors
In our prior two articles [RMI Applications: Sector Rotation Using ETFs and RMI Applications: Tail Risk Hedging], we outlined two practical approaches to implementing Risk-Managed Investing (RMI). RMI is the attempt to embed equity risk management directly in the equity investment itself, an innovative approach that we introduced and evaluated earlier in this series (see archive here). In this installment, we conduct a broader, but brief, review of RMI strategies currently available in the marketplace. These can be largely classified into:
- Strategies based on equity options
- Strategies based on VIX options and/or futures
- Low-volatility strategies
Some of these methods focus on downside risk mitigation while others concentrate on dampening volatility in both directions. In reviewing the marketplace, to avoid endorsing or disparaging any specific commercial products, we will examine several indexes that are representative of the above approaches and which a number of products are based upon or benchmarked against.
Equity Options-Based Strategies
There are two indexes that, between them, characterize most of the risk-managed strategies employing equity options.
The first index is the CBOE S&P 500 5% Put Protection Index (PPUT). PPUT tracks the performance of a hypothetical strategy that (i) holds a long position indexed to the S&P 500 Index and (ii) buys rolling monthly 5% out-of-the-money S&P 500 Index put options as a hedge. To some, this is a realization of the most direct downside-risk-management strategy, i.e. purchasing protection against losses beyond a certain level. In this case, the protection lasts for a month, after which it must be purchased again. In the meantime, the downside protection is not on a drawdown basis, meaning that, if the S&P 500 Index increases 10%, say, during the month, the put strike would then be 15% out of the money, not 5%. The annual cost of the strategy is the price paid for a series of 12 monthly puts, which can be quite expensive.
The second index is the CBOE S&P 500 95-110 Collar Index (CLL). CLL tracks the performance of a hypothetical strategy that (i) holds a long position indexed to the S&P 500 Index, (ii) buys rolling three-month 5% out-of-the-money S&P 500 Index put options as a hedge, and (iii) sells rolling one-month 10% out-of-the-money S&P 500 Index call options to help finance the cost of the put options. While the motivation for a collar is to reduce the explicit cost of purchasing a hedge by selling calls, there are costs implicit in the cap imposed on the gains that can be realized. In robust equity bull markets, this indirect cost can be quite substantial.
VIX-Based Strategies
Volatility is a statistical measure of the dispersion of returns. The appeal of hedging equities by “investing in volatility” is that volatility tends to have a strongly negative correlation to equity market returns — in particular, it tends to spike when equities sharply decline. Additionally, the cost of maintaining the volatility exposure can be less than that of purchasing outright equity options such as those described in the prior section. There are two indexes representative of this approach. Both employ the CBOE Volatility Index (VIX), a leading measure of market expectations of near-term volatility conveyed by S&P 500 Index option prices.
The first of these indexes is the CBOE VIX Tail Hedge Index (VXTH). VXTH tracks the performance of a hypothetical portfolio that (i) holds a long position indexed to the S&P 500 Total Return Index and (ii) buys rolling one-month 30-delta call options on the VIX. The allocation to the VIX options is determined based on the level of the VIX according to a schedule published at http://www.cboe.com/micro/VXTH/.
The power of the VXTH index comes from the exceptionally high returns garnered by VIX calls in times of steep stock market declines. While this is a promising strategy for sudden and steep market declines, there are significant costs associated with carrying this strategy during non-turbulent market periods, i.e., periods when there are no marked spikes in VIX, as the call options expire worthless.
The second index in this category is the S&P 500® Dynamic VEQTOR Index (SPVQD). SPVQD dynamically allocates long-only exposure among (i) the S&P 500 Index, (ii) the S&P VIX® Short-Term Futures Index (VXX), and (iii) cash, in an effort to provide downside protection in volatile markets.
SPVQD accesses implied volatility via futures, as opposed to the VIX calls employed by VXTH. SPVQD is subject to similar trade-offs as VXTH as it too is subject to the cost of carry during most periods except those periods with a marked spike in VIX futures.
Volatility-Reduction Strategies
The MSCI USA Minimum Volatility Index seeks to identify U.S. large- and mid-cap equities that, in the aggregate, have lower volatility characteristics than the broader market. The index uses risk models reflecting the covariance among stocks to optimize stock selection and imposes constraints on the distribution of exposure among industry sectors.
The S&P 500 Low Volatility Index measures performance of the 100 least volatile stocks in the S&P 500 Index using recent history. Constituent stocks are weighted relative to the inverse of their corresponding volatility, with the least volatile stocks receiving the highest weights.
While these strategies have been successful in producing return streams less volatile than the S&P 500 Index, neither strategy has an explicit mandate to provide downside protection. In fact, during the -45% drawdown in the S&P 500 Total Return Index from 9/12/2008 to 3/9/2009, for example, the declines in the MSCI USA Min Vol Index and the S&P 500 Low Vol Index were -41% and -34%, respectively — each multiple times worse than the performance of either of the two strategies we highlighted in our prior two articles [link and link].
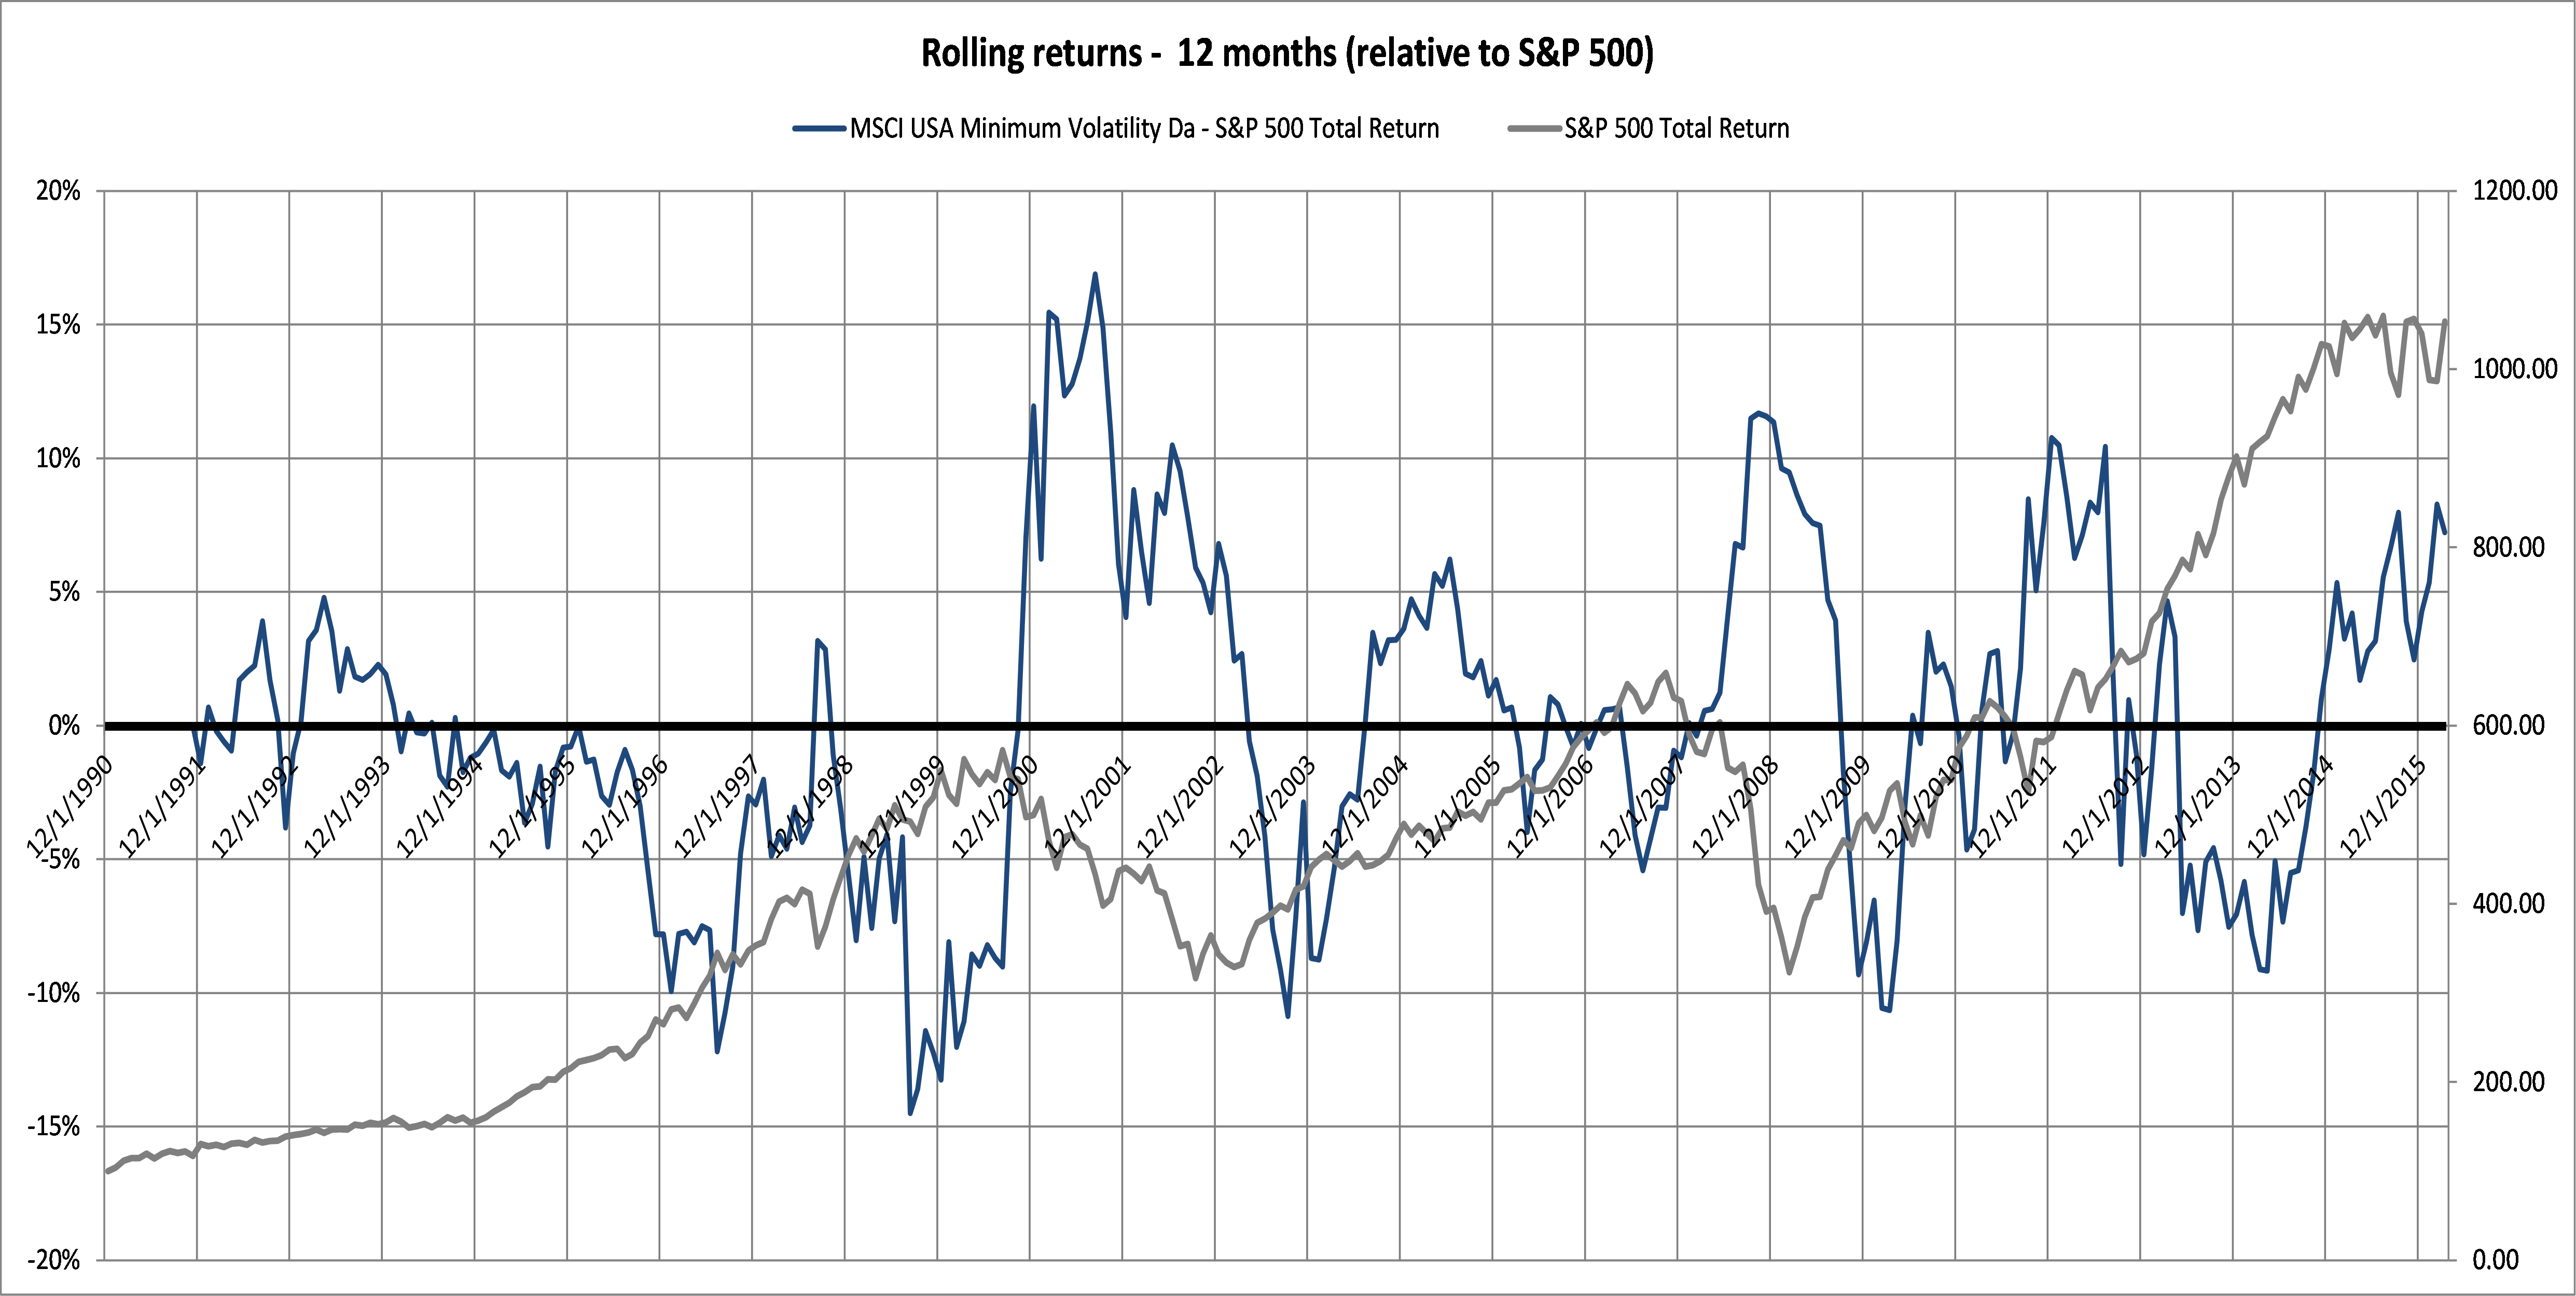
Investment products based on these indexes have become very popular in recent years, likely spurred by the fact that they have significantly outperformed the S&P 500 Index since the beginning of 2014. Viewing performance over a longer period, since the beginning of 2012 for example, reveals that this outperformance disappears. In fact, the graph below, which shows the difference in the returns of the MSCI USA Minimum Volatility Index and the S&P 500 Index on a rolling 12-month basis, illustrates that the relative performance has been a cyclical phenomenon. It also appears that we may now be at or near a peak in this relative performance, which would represent the wrong phase of the cycle during which to invest in this strategy.
Summary Observations
We hope that this marketplace review was informative and served to highlight the differences among the various strategies one might consider to create an RMI portfolio. In our own research into RMI strategies over the last several years, our primary conclusion is this: We have found that a combination of the two strategies we outlined in our earlier pieces, [link and link], is likely to be more cost-effective over the long term than any — or any combination — of the strategies covered in this marketplace review.
This article was written by Jerry Miccolis, Gladys Chow and Rohith Eggidi of Giralda Advisors, a participant in the ETF Strategist Channel.
[related_stories]Disclosure Information
This material is for informational purposes only. Nothing in this material is intended to constitute legal, tax, or investment advice. Investing involves risk including potential loss of principal.
Giralda Advisors, located in New York City, is an asset management firm that focuses on providing risk-managed exposure to the equity markets with a goal of limiting asset depreciation during both protracted and catastrophic market downturns while allowing substantial asset appreciation in up-trending markets. The Giralda Advisors team welcomes your inquiries. Call 212.235.6801 or visit http://www.giraldaadvisors.com/.