Note: This article appears on the ETFtrends.com Strategist Channel
By Sauro Locatelli
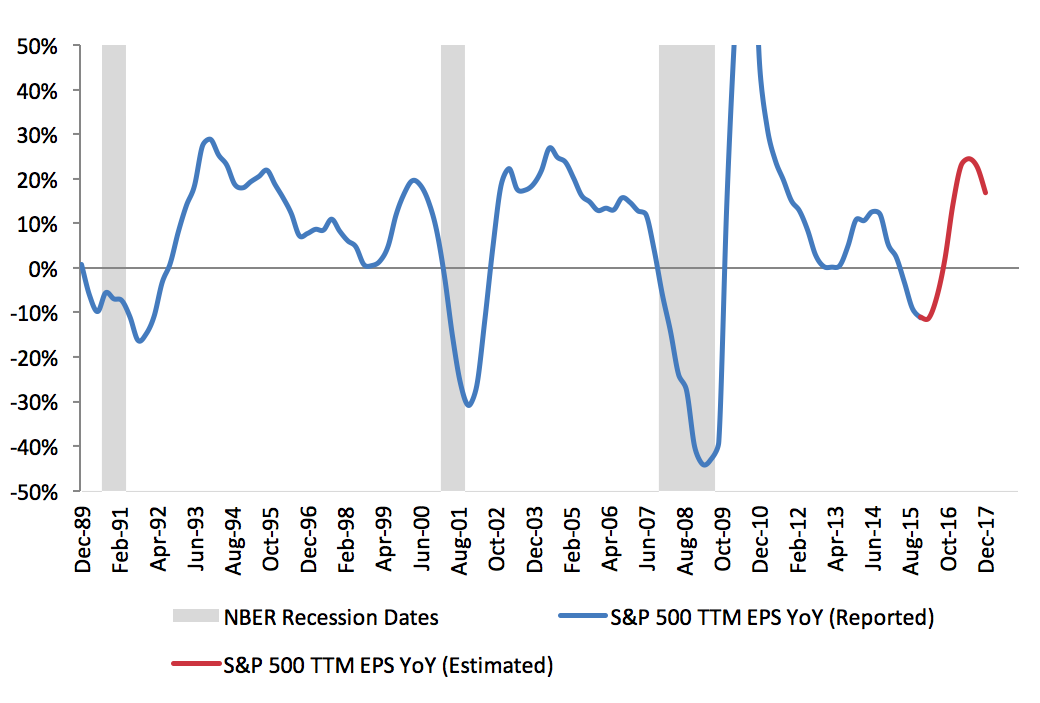
With more than 90% of companies in the S&P 500 having reported results for the first quarter of 2016, it now looks increasingly likely that Q1 2016 will mark the sixth consecutive quarter in which S&P 500 TTM (trailing-twelve-month) reported earnings have been falling. Based on numbers reported by S&P Dow Jones Indices, S&P 500 TTM earnings peaked at $105.96 in Q3 2014 and are expected to come in at $86.25 for Q1 2016, which would constitute an 18.6% decline. Not only have earnings been falling, but the speed at which earnings have been falling has also been accelerating, from -3.2% in Q2 2015 to an expected -11.4% in Q1 2016. This is shown in the chart below, where the blue line represents year-over-year growth in S&P 500 TTM earnings.
Chart 1 – Source: S&P Dow Jones Indices, National Bureau of Economic Research
The bad news is: looking at the last 25 years of history, prolonged periods of negative earnings growth—such as the one we currently find ourselves in—have always been associated with economic recessions, represented by the grey areas on the chart above. The good news is that analysts are already turning more optimistic, with average estimates calling for earnings to trough at $86.25 in Q1 2016 and to reach $124.95 by Q4 2017. In terms of year-over-year growth rates, these estimates imply a trough at -11.4% in Q1 2016 and a peak at 24.4% in Q2 2017.
This expected recovery in earnings growth is represented by the red line in the chart above. Much of this newfound optimism concerning the near-term outlook for earnings comes from the recent rebound in crude oil prices. After falling a whopping 75% from a peak of $114 a barrel in April 2011 to a trough of $26 a barrel in February 2016, WTI (West Texas Intermediate) crude oil prices have since recovered some of their value and are currently trading at about $48 a barrel. Given that much of the weakness in S&P 500 earnings has been related to energy companies, the latest rebound in oil prices is causing these companies to breathe a sigh of relief. However, while it is certainly true that the energy sector has seen the worst earnings growth out of the ten S&P 500 sector, other sectors have also experienced a significant slowdown in the growth rate of their bottom line, with most of them now sitting in the low single digits. This suggests that something more broad-based may be at play.
Related: Experiencing Economic Vertigo: How to Stomach Market Indigestion
As a Quantitative Analyst at Pinnacle Advisory Group, part of my job consists in applying quantitative methods to financial and economic variables in order to try to distinguish between perceived relationships and relationships that are actually quantifiable in a statistically significant way. In my research for variables that could have a quantifiable and statistically significant relationship with the future growth rate in S&P 500 earnings, I found consumer comfort to be one of the most relevant ones, and by far more relevant than crude oil prices. This makes intuitive sense, as consumer spending represents about 70% of the U.S. economy.
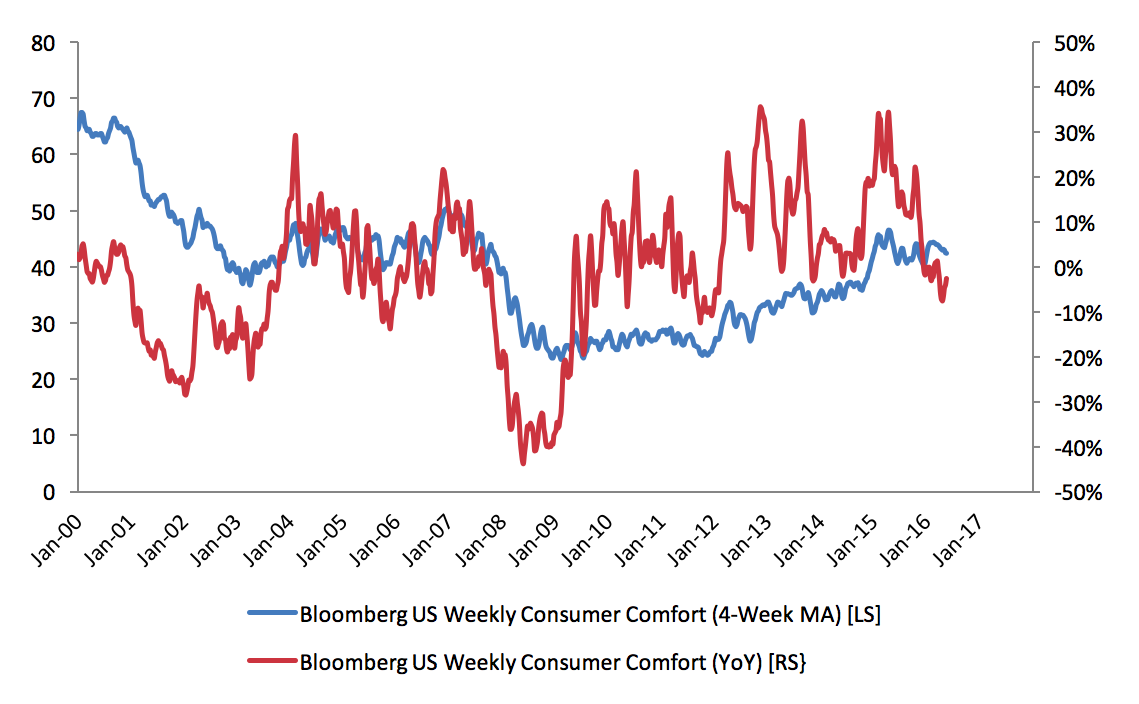
The chart below contains two ways of looking at consumer comfort, as measured by the Bloomberg U.S. Weekly Consumer Comfort Index. The blue line, based on the left scale, represents the level of the index, using a four-week moving average to smooth out some of the short-term gyrations. The red line, based on the right scale, represents the year-over-year change in the index. Over the last year or so, while the overall level of consumer comfort (blue line) has been moving more or less sideways at a level that is fairly positive, the yearly change in consumer comfort (red line) has been on a nosedive, falling from over +30% down into negative territory.
Related: 3 High Octane Value Trades for a Bear Market
Our research indicates that it is the latter way of looking at consumer comfort (i.e. its rate of change) that matters for the future growth of S&P 500 earnings. In other words, it doesn’t matter how the consumer is feeling currently, what matters is whether the consumer is feeling better or worse than it was feeling prior. More precisely, we estimate that each 1% decline in the Bloomberg U.S. Weekly Consumer Comfort Index could be detracting 0.48% from S&P 500 earnings growth over the following year, which means that the recent dive in the rate of change of consumer comfort is taking away a +15% tailwind from earnings.
I have one more piece of good news: Consumer comfort is only one of the variables that make up our quantitative model that we use to forecast S&P 500 earnings growth, and one should never make a forecast based on just one variable. While consumer comfort is clearly heading in the wrong direction, other variables included in the model (crude oil prices and credit spreads, just to name two) have been improving, which is providing the model with some support. At present, the overall model is forecasting that earnings growth will remain moderately negative over the next six to twelve months, and that the speed of the decline should ease and stabilize. This is one of the reasons why we fear that current earnings estimates may be too optimistic. As always, only time will tell.