
These episodes, which reflect drawdowns of -10% or worse, are therefore relevant for assessing RMI strategies whose drawdown threshold metric, D, is -10%. Let us first examine an RMI strategy that provides 50% downside protection against a decline threshold of -10%, that is, one whose D and p metrics are -10% and 50%, respectively. Such a strategy succeeds in modestly reducing the decline on the initial investment, from -21% to -15.5% (i.e., by half the excess decline beyond -10%), net of the cost of the strategy. Thus, the subsequent 25-month bull market run need be only +57% cumulatively instead of +68% to achieve the “breakeven” value that would have been attained in the absence of the strategy.
Surprising Results
What does the above result mean in terms of the annual tolerable cost, CT? The annualized equivalent of the +68% 25-month return is +28.3%, while the annualized version of the +57% 25-month return is +24.2%. The difference is 410 basis points. So, here is the result: If history is a guide, an RMI strategy whose downside protection reduces only large declines in the equity markets (i.e., those worse than -10%), and reduces them only modestly (specifically, by half their excess beyond -10%), adds measurable value as long as its cost (i.e., its performance drag during bull markets) does not exceed 410 basis points per year. In other words:
CT(-10%, 50%) = 410 bps
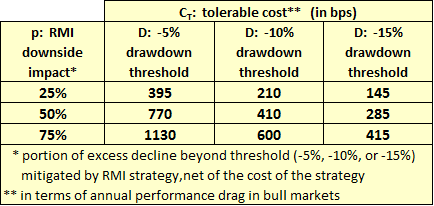
For another example, an RMI strategy whose downside protection reduces declines worse than -10% by three-quarters of their excess beyond -10% adds measurable value as long as its cost (i.e., its performance drag during bull markets) does not exceed 600 basis points per year. That is, CT(-10%, 75%) = 600 bps. Similarly, we find that CT(-10%, 25%) = 210 bps.
In the table below, we show the results for drawdown thresholds of -5% and -15%, in addition to the -10% threshold already discussed.
Source: Giralda Advisors analysis of Bloomberg daily return data
If you are like us, you are probably surprised at first observation that these tolerable costs are as high as they are. The reason RMI can support such high tolerable costs is because of the power of return asymmetry, discussed in our prior article, “Alpha Generation through Risk-Managed Investing.”
We should point out the tolerable cost estimates, CT, derived through this analysis are conservative, as explained in our whitepaper. We should also point out that, from a total portfolio perspective, there is an important dimension of value that we have not yet explicitly considered. Our derivation of CT has concentrated solely on cumulative return. But RMI strategies, by virtue of their risk-dampening properties, can also mitigate portfolio risk and thereby elevate the efficient frontier. We will explore this additional dimension in a subsequent installment.
This article was written by the team at Giralda Advisors, a participant in the ETF Strategist Channel.
This material is for informational purposes only. Nothing in this material is intended to constitute legal, tax, or investment advice. Investing involves risk including potential loss of principal.
Giralda Advisors, located in New York City, is an asset management firm that focuses on providing risk-managed exposure to the equity markets with a goal of limiting asset depreciation during both protracted and catastrophic market downturns while allowing substantial asset appreciation in up-trending markets. The Giralda Advisors team welcomes your inquiries. Call (212) 235-6801 or visit http://www.giraldaadvisors.com.
