Based on conversations with our partner financial advisors, one of the most troubling and confusing aspects of recent market volatility is the close connection between the oil market and the stock market. If oil prices fall during the trading day, then equity prices almost inevitably follow oil lower.
Falling oil prices are typically seen as beneficial to global consumers, and equity prices outside the energy sector historically tend to be largely immune to or even benefit from cheap oil. The few times in history that oil and stock prices have fallen in tandem were driven by the onset of a global recession. Thus, despite robust US job gains, improving new home sales, and the positive impact of lower gas prices on their personal finances, investors are increasingly fearful that the close correlation between oil and equities is once again signaling a recession and the potential for a market crash similar to 2008. We strongly disagree.
Instead, We Believe:
The meltdown in oil prices is driven by excess supply rather than slumping demand, and is not signaling the onset of a global recession.
The strong connection between oil prices and equity markets has been caused by forced liquidations from the sovereign wealth funds of the major oil-producing countries. The impact of this forced selling is likely to diminish as equity markets anticipate accommodative moves by the European Central Bank (ECB) and the Bank of Japan (BOJ), and a pause in interest rate increases by the Federal Reserve.
This is not 2008. The current debt crisis is in the oil industry, while in 2008 the problem was housing. The housing industry dwarfs the energy industry in size and economic importance, in our view. Collapsing home prices crippled the 70% of consumers who owned a home and the vast majority of banks overexposed to mortgage debt. Further, it did so without producing any economic “winners,” as almost no one benefited from the 30% drop in home prices. In the current situation, low oil prices are hurting oil producers and the handful of banks and investors that lend in that space. The economic winners from low oil prices include virtually every other sector of the economy.
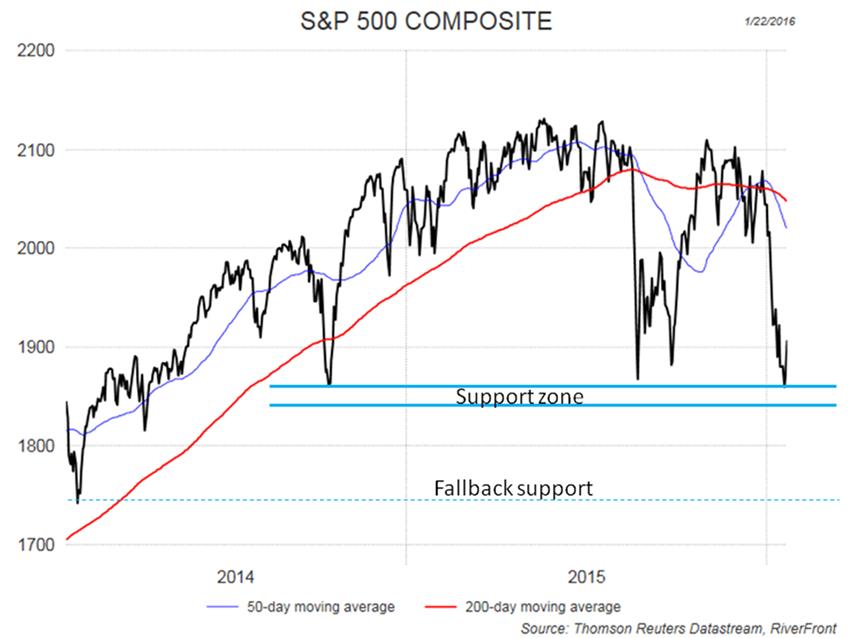
It’s time to start buying. Recent trading patterns (dropping through our support levels but rallying back above support by the close) look like a potential “capitulation” that often marks the end of a correction. Over the past two months we raised between 20% and 30% cash in our portfolios as the S&P 500 broke our stop losses of 2050, 1985 and 1940. With the market having tested and held in our support zone (1840-1860), we are looking to opportunistically putting that cash back to work.
Oil – The Problem Is Excess Supply
In late 2014, Saudi Arabia began pursuing a strategy of producing enough oil to reestablish their position as the dominant supplier of oil in the global market. Although the long run impact of the extra Saudi oil may ultimately be to drive out higher cost producers, over the short term these higher cost producers have continued to produce at near record volumes. Whether a US fracker trying to cover interest payments or a Russian oil minister trying to meet revenue targets, low oil prices are paradoxically pushing more oil onto global markets. As shown in the chart below, oil supply has been increasing far faster than the rate of demand ever since the shift in Saudi strategy.
The chart also makes clear that demand, while not keeping up with surging supply, has continued to grow at about the same pace for the past 5 years. Bears will correctly point out that demand should be accelerating in the face of such dramatic declines in oil prices, but we believe that structural and policy changes in China have masked the increased oil consumption occurring in the developed economies of the world.
China is the world’s largest consumer of oil and the most important source of demand growth for petroleum products. Given their dominant position in global energy markets, China’s slowing economic growth and shift away from energy-intensive manufacturing is clearly weighing on global energy demand. According to the EIA, China’s share of oil demand growth is estimated to have fallen from 43% in 2014 to almost 25% in 2015. However, global oil demand continued to increase at its trend rate of growth in 2015, meaning that demand outside of China must have accelerated enough to offset China’s decline. This supports our belief that low oil prices are strengthening the economic recovery in developed economies like the US, Europe and Japan.
An additional consideration for investors is the effect of China’s current energy policy is on internal demand for oil. Chinese leadership is very committed to domestic energy production and next-generation energy technologies. Lower oil prices threaten the massive investments China’s state-owned enterprises have made in these industries. To protect these investments, China is currently maintaining a $40 floor on the price of oil. Chinese consumers and companies do not benefit as prices drop below this floor, and therefore the largest oil importer in the world isn’t increasing consumption as prices continue to fall. The $40 floor allows China’s government to profit as oil prices decline, and it has no financial incentive to alter this policy. Thus, investors should not expect a sudden surge in demand from China, even if their economy accelerates.
Sovereign Wealth Funds: The Linkage between Oil and Equities
Relatively high oil prices over the past decade allowed oil-producing nations (Saudi Arabia, Kuwait, Norway, Bahrain, etc.) to accumulate petrodollars in sovereign wealth and other types of reserve funds. Like many investors, ultra-low interest rates caused these funds to seek higher returns outside of government guaranteed bond markets. Sovereign wealth funds bought hundreds of billions in equity, corporate bond and real estate investments with the surplus revenue made possible by high oil prices. According to Bloomberg, these funds currently account for between 5 to 10% of total global investment dollars.[1] Low oil prices are turning budget surpluses into deficits, and these funds are having to sell assets to make up for the budget shortfall. For example, over the last 6 months Saudi Arabia’s reserves have shrunk by more than $100 billion.
These sovereign wealth fund liquidations have trapped the markets in a self-reinforcing cycle – low oil prices force oil producers to pump more oil to fund their budget deficits. That makes oil prices go down, so they sell stocks to fund the budget gap. Selling pressure from the sovereign wealth funds make stock prices go down, which means the funds have to sell even more to meet their fundraising targets, causing additional downward pressure on stocks. The process repeats with the next drop in oil.
Ending this cycle requires a forecast of stable oil prices, something that we are not yet prepared to make. Instead, we believe that the combination of attractive equity valuations, improving fundamentals, and strong technical support will start attracting enough buyers to compensate for continued selling by sovereign wealth funds.
An Improving Picture for Global Equity Markets
Based upon RiverFront’s Price Matters® methodology, US equity markets are now slightly below their long-term trend, and the sharp drop in small cap equities in 2016 has finally returned this long-overvalued asset class back to attractive levels. Meanwhile, developed international markets in Europe and Japan have fallen to valuations last seen during some of the worst periods of the European debt crises and before the introduction of Abenomics in Japan. Traditional equity valuation measures appear to confirm our Price Matters® assessment, with the S&P 500 trading at about 15x last year’s estimated earnings compared with a long-term average of about 16x. This valuation is especially attractive given the current interest rate environment, and we believe the turmoil in oil markets may allow global interest rates to remain far below average for a considerable period in the future.
We think that the plunge in oil prices since the last Federal Reserve meeting may have allayed the Fed’s short-term inflationary concerns for the time being. As a result, we believe that the Fed is very likely to put further interest rate increases on hold until at least their March meeting. Any delay in Fed tightening may help stabilize the oil market by reducing upward pressure on the dollar, and help improve sentiment in the equity markets. A pause in Fed rate increases is likely to be accompanied by additional easing moves by the ECB and BOJ. ECB President Mario Draghi strongly hinted in his comments following their January meeting that turmoil in the oil market could prompt additional stimulus measures, and the obvious deflationary pressure of oil at $30 per barrel may silence German opposition to more aggressive ECB action. The BOJ faces even more imminent need for policy moves, as falling oil prices are reversing the progress Abenomics has made toward increasing Japanese inflation expectations
In addition to attractive valuation and potential for policy stimulus, the positive support for equity markets is enhanced by an improving technical picture. RiverFront raised as much as 30% cash in our portfolios as the S&P 500 broke successive stop losses at 2050, 1980 and 1940. When raising this cash, we established 1840-1860 as the likely support zone for equity markets. On January 20th, this support was broken in a sudden dramatic drop during intraday trading, but buyers came in before the close and the market ended above our support levels. We believe this behavior resembles “capitulation” trades that have often marked the end of market corrections. The odds of higher markets levels calculated by our technical trading model also increased after these market gyrations, and we have started putting money back to work.
As shown in the chart below, the S&P 500 at a level of 1840-1860 represents strong technical support; but, if these levels do not hold, the market could experience an additional drop of as much as 5 to 6% before finding additional support around 1750. We recognize that by starting to put money to work now we might not catch the absolute bottom in equity markets, but with both our fundamental and technical processes calling for higher markets we are staying true to our investment disciplines.
This is Not 2008
Attractive valuation, additional monetary stimulus and strong technical support will not prevent further market declines if investors become convinced that collapsing oil prices will produce a debt crises similar to the one experienced in 2008. We believe that the economic impact of the energy industry and the size of its debt problems is much less significant than the housing/mortgage crises of 2008.
From an economic perspective, the oil and gas exploration industry is a fraction of the size of the housing industry. According to the Bureau of Labor Statistics, US employment in the oil and gas exploration has fallen over the past year from a little over 200,000 to about 184,000. By comparison, employment in the home construction industry fell from a peak of 7,400,000 in 2005 to less than 4,500,000 at the depths of 2008. The jobs lost in the housing industry during the Great Recession were 10 times greater than total jobs in oil and gas exploration. The oil and gas industry supports many more jobs in related fields like pump manufacturers, trucking firms and capital equipment manufacturers, but jobs in industries related to the housing market are even more economically significant (e.g. appliances, furniture, carpeting). We believe that the housing market will enter 2016 with significant positive momentum, fueled in part by higher disposable income made possible by lower prices at the pump. Continued recovery in housing can more than offset problems in the oil patch, in our view.
The debt problems of the energy industry are similarly dwarfed by the size of the mortgage crises of 2008. According to a report by Ed Westlake at Credit Suisse, “in four years of $100/bbl oil, the global oil and gas industry has taken on a quarter of a trillion dollars in debt.”[1] While $250 billion in speculative energy debt is a daunting figure, it pales in comparison to the magnitude of the 2008 US mortgage crises. Mortgage debt soared to over $11 trillion by 2008, and in the next few years over 9% of these loans became more than 90 days delinquent. Even if 100% of the debt taken on in recent years by the global oil industry were to default (a highly unlikely occurrence, in our view) these defaults would be less than 25% of the nearly $1 trillion in mortgage loans that went bad in the Great Recession.
Not only is the size of the energy debt not comparable to the 2008 mortgage crises, the banking industry is less exposed to these risks. Regulators allowed banks to leverage mortgages 25 to 1, and leverage AAA mortgage backed securities 50 to 1. This regulatory incentive encouraged banks to overinvest and overleverage in supposedly “safe” mortgage debt. By contrast, energy lending is well recognized as high risk and banks must back these loans with far more capital than was the case with mortgages. Banks have therefore been far less active in energy lending than was the case with mortgages, and any defaults represent much less of a threat to the global financial system, in our view.
Investment Implications
RiverFront’s investment discipline seeks to combine art and science into the management of our client portfolios. The science of our approach is our Price Matters® discipline, and this process suggests that equities, especially developed international equities, are priced to provide attractive returns over the next 5 years. The art in our management process is the short term technical and fundamental analysis that guide risk management and the timing of our reinvestment decisions. Both the art and science of our discipline suggest that the current pull back has run its course and it is time to reinvest the cash that we have accumulated. As with every investment decision at RiverFront, we have a risk management plan in place in case of assessment of market conditions proves overly optimistic.
Michael Jones is the Chairman and Chief Investment Officer at RiverFront Investment Group, a participant in the ETF Strategist Channel.