Breaking Down Pullbacks
Pullbacks are a common occurrence in the equity markets. The upward trend is quickly reversed creating a shift that signals a slight pause in the upward momentum. When a pullback occurs in this type of environment, investment professionals often identified this as a buying opportunity or a sign of a definite downward trend depending on the percent decline.
During the cyclical bull markets since World War II, there have been 106 pullbacks- 13 during the 1990s bull, 12 during the 2002-2007 bull and 19 during the current bull market. On average, there have been three to four pullbacks each bull market year and the current 2009-2015 period is no exception.
As you can see in the chart below, there are three basic types of market declines that are simply distinguished by the size of the decline: A pullback is defined as a 5-10% drop, a correction is a 10-20% decline and a bear market is a 20+% decline.
| S&P 500® Index Price Declines (Excluding Dividends): 1946-2015 | ||||
|
Type of Decline |
Percent Decline |
Count |
Average Change | Duration in Months |
| Pullbacks | 5-10% | 106 | -7% | >1 |
| Corrections | 10-20% | 20 | -14% | 5 |
| All Bear Markets | 20+% | 12 | -28% | 14 |
| Uncomfortable Bears | 20-40% | 9 | -26% | 11 |
| Hellacious Bears | 40+% | 3 | -51% | 23 |
| Source: LPL Financial Research, Bloomberg, Capital IQ, Standard and Poor’s and Beaumont Capital Management | ||||
Why the Interest in Pullbacks?
We believe that no tactical strategy would be able to successfully avoid ordinary 5-10% pullbacks and provide timely reinvestment without being subject to whipsaw. Whipsaw occurs when the price of a security heads in one direction, but is quickly followed by a movement in the opposite direction. The term’s origin is from the push and pull action used by two lumberjacks to saw wood with a large, two- handled saw.
The Element of Time
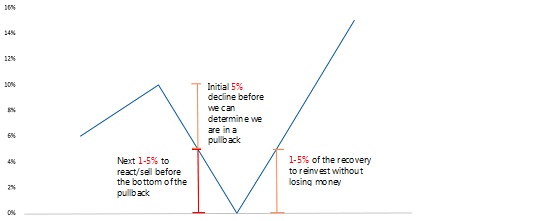
The chart below illustrates an example of this. Let’s say we are experiencing a pullback that will bottom at -10%. The first 5% decline simply alerts the manager that the market is in a pullback. Then, the strategy only has between -5% to -10% of additional decline to react (sell) if the strategy is to “avoid” any of the pullback. If a manager successfully gets out of the market before the bottom, he then has less than 1-5% of the initial recovery to reinvest without incurring a loss.
Most pullbacks have lasted just a week or two, often merely a few days. We think it is unrealistic that any strategy would be able to correctly sell and buy in such narrow windows, and attempting to achieve this increases the likelihood of whipsaw. If you apply this scenario to a strategy that employs margin, leverage or shorting, it only exacerbates the situation and can make the reaction windows even smaller.
Defensive Tactical Strategies
Since pullbacks occur with frequency and consistency, tactical strategies that avoid reacting to pullbacks can have a distinct advantage. In fact, not reacting to common pullbacks in bull markets has proven to be the better course of action from a performance, turnover and expense standpoint since 1946. It is not the ordinary pullbacks that devastate a portfolio; it is the large losses, corrections or bears, that induce investors to sell in the capitulation stage of a bear market, and can hinder long term success.
David Haviland is a Managing Partner and Portfolio Manager at Beaumont Capital Partners, a participant in the ETF Strategist Channel.